Baseball as a Thermodynamic System: Run Environments and the Measurement of Greatness
Baseball as a Thermodynamic System:
Run Environments and the Measurement of Greatness
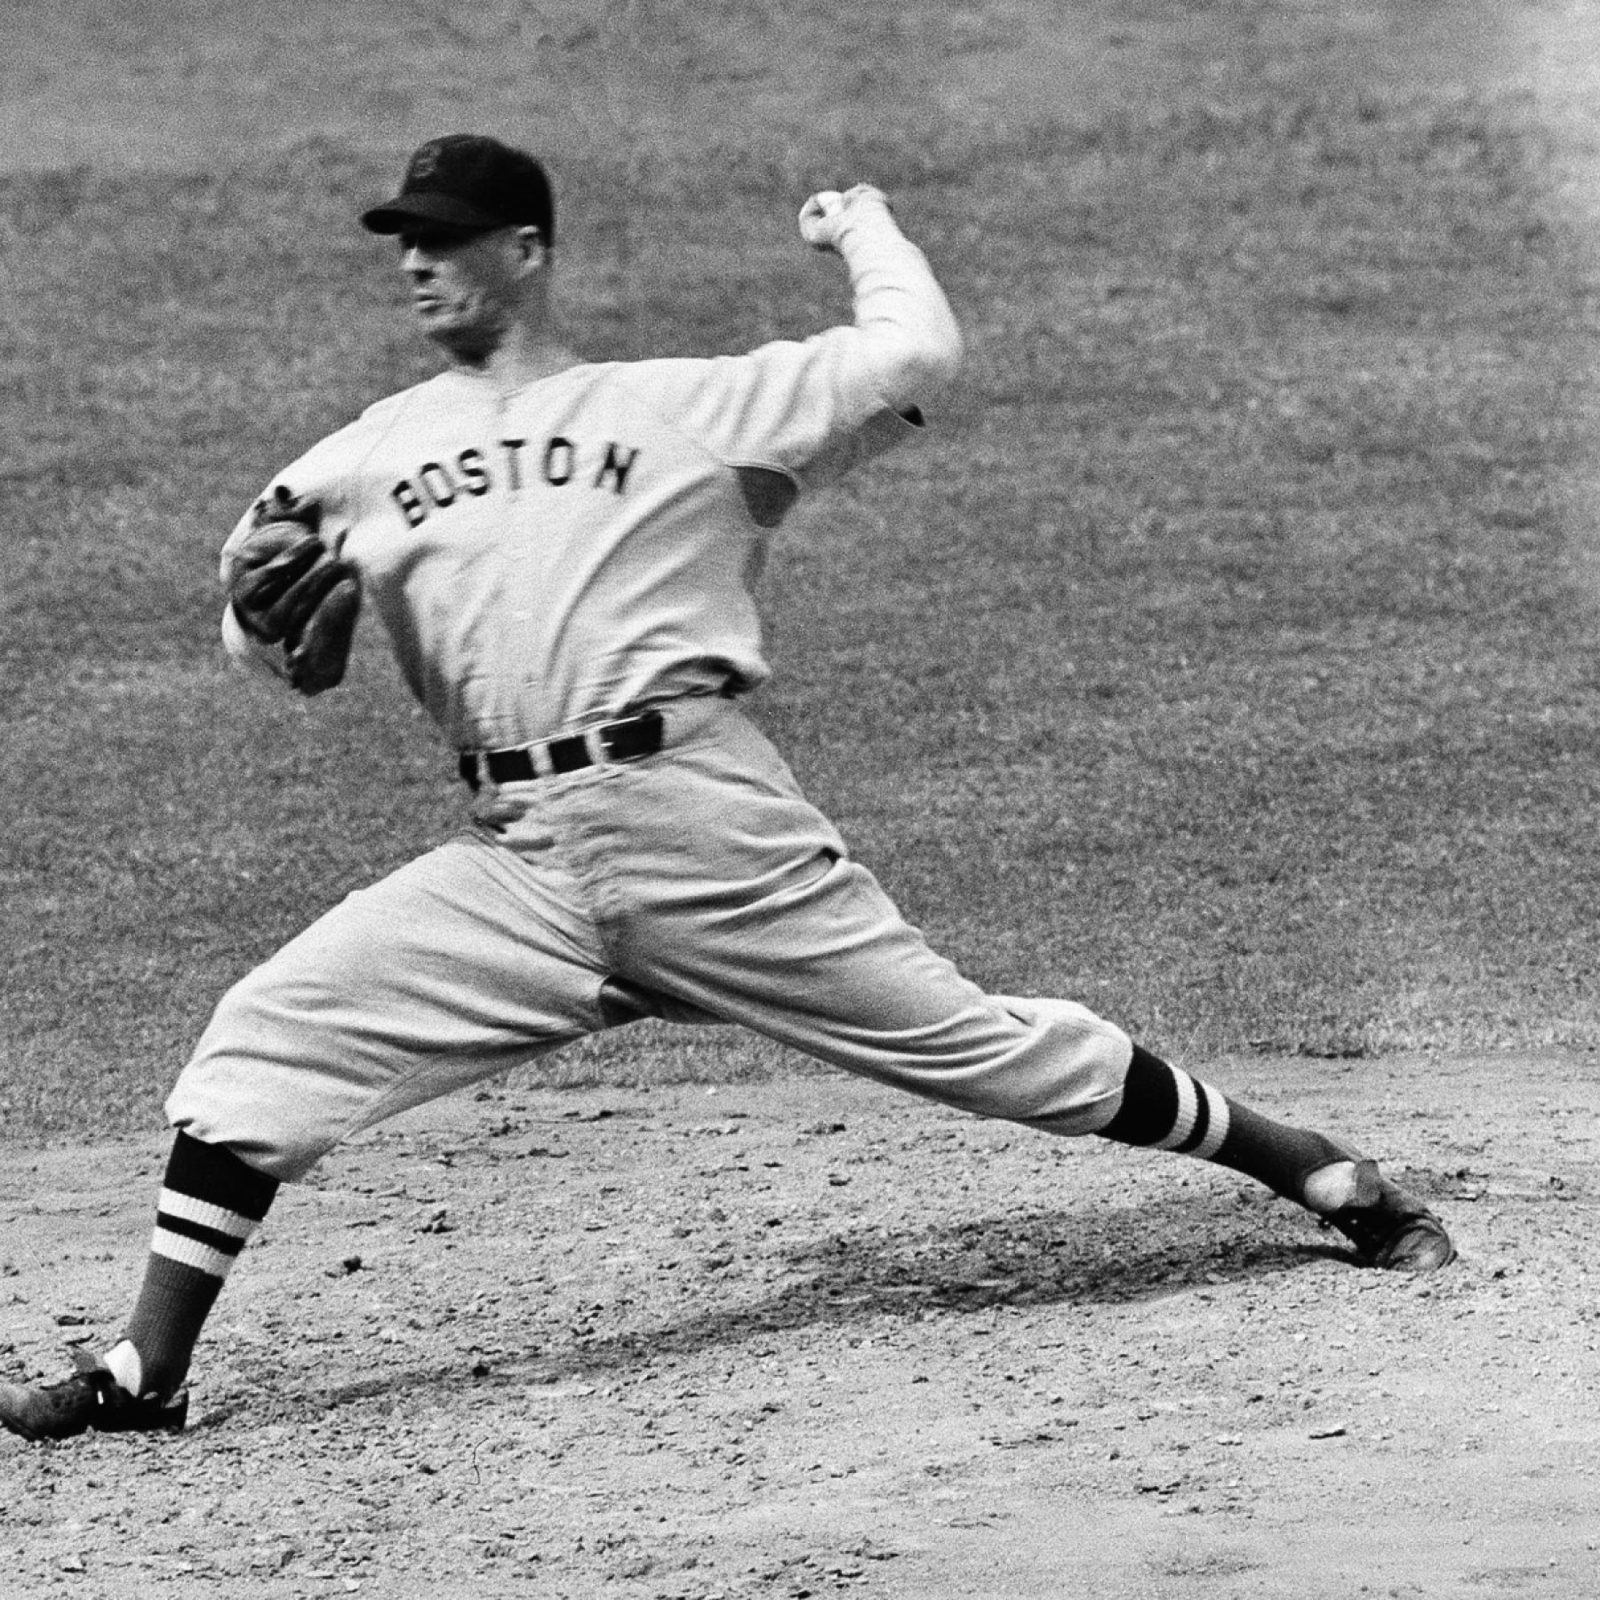
Baseball can be understood as a competitive system operating around an equilibrium of run production. In each historical era, the league run environment establishes the baseline energetic condition of the game. Great hitters expand this system by generating offense beyond its natural limits, while great pitchers compress it by suppressing run production against the momentum of the environment. The magnitude of a player’s greatness is therefore measured by the degree to which he displaces the equilibrium of his era. Baseball history is the record of those rare individuals who forced the system of the game beyond its equilibrium limits.
The Thermodynamic Structure of Baseball
Abstract
Baseball statistics are produced within a competitive system whose structural conditions evolve over time. Changes in rules, equipment, pitching mechanics, ball construction, and league organization alter the environment in which offensive and defensive performance occurs.
This paper proposes a thermodynamic framework for understanding baseball history. In this model, baseball can be understood as a competitive system in which offensive pressure is introduced, defensive forces attempt to constrain it, and runs represent the measurable output of successful energetic transformation.
Because the scoring environment of the game changes across time, each historical era possesses its own equilibrium level of run production. Player greatness must therefore be evaluated relative to the environment in which performance occurs.
Greatness = distance from the run-production equilibrium of the era.
1. Baseball as a Competitive Energy System
A baseball game is a sequence of interactions between two opposing forces.
Hitters introduce offensive pressure through:
bat speed
contact quality
baserunning advancement
Pitchers and defenses attempt to dissipate that pressure through:
velocity
pitch movement
location
defensive execution
Runs represent the successful conversion of offensive pressure into scoring outcomes.
Over the course of a season, the balance between these forces produces a league scoring equilibrium , visible as the average runs scored per game.
2. Run Environment Across Baseball History
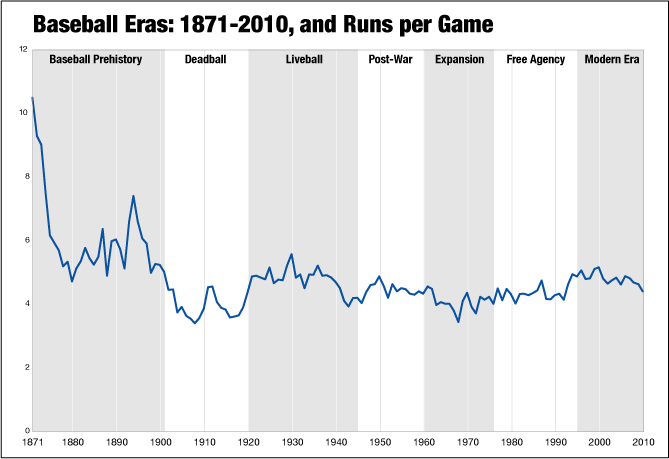
The historical run environment of baseball has shifted dramatically since the beginning of professional play in 1871.
The figure above illustrates average runs per game across baseball history. Several major phases are visible.
Early Baseball (1870s–1890s)
The earliest professional decades produced extremely volatile offensive conditions.
Run scoring often ranged between roughly 5 and 7 runs per team per game , with several seasons in the 1890s reaching the upper end of that range.
Several factors contributed:
evolving rules governing balls and strikes
shorter pitching distances prior to 1893
limited fielding equipment
high defensive error rates
The 1893 rule change establishing the modern pitching distance of 60 feet 6 inches significantly altered the pitcher–hitter balance.
Deadball Era (1901–1919)
The early twentieth century produced the most suppressed offensive environment in modern baseball history.
Average scoring frequently fell near 3.5–4 runs per team per game.
Contributing factors included:
infrequent replacement of baseballs during games
large ballparks
emphasis on contact hitting and bunting
dominant pitching
This period represents a strongly defense-favored equilibrium.
Live Ball Expansion (1920–1939)
Beginning around 1920, baseball entered a more offensive regime.
Important changes included:
more frequent replacement of baseballs
restrictions on doctored pitches
the emergence of power hitting
Players such as Babe Ruth symbolized this shift.
League scoring rose to approximately 4.5–5.5 runs per team per game , with extraordinary offensive peaks such as the 1930 season , when scoring reached one of the highest levels in modern baseball.
3. Pitchers and Hitters as Opposing System Forces
Within this framework, pitchers and hitters function as opposing agents within the run-production system.
Hitters attempt to convert opportunities into offensive outcomes. Pitchers attempt to prevent those outcomes through command, deception, and contact suppression.
The run environment represents the equilibrium point produced by the interaction of these forces.
When pitching dominance increases, scoring declines. When offensive production increases, scoring rises.
The historical record therefore reflects shifts in the balance between these two forces.
4. Evaluating Greatness Relative to Environment
Because the run environment changes across time, raw statistical totals cannot serve as universal measures of player value.
A hitter producing high totals in a high-scoring environment may represent a smaller deviation from league norms than a player producing slightly lower totals in a suppressed environment.
Conceptually, player dominance is measured relative to league average performance:
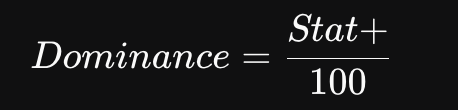
Where Stat+ represents metrics such as OPS+ for hitters or ERA+ for pitchers.
A value of 1.00 represents league-average performance, while values above 1.00 indicate performance above the league equilibrium.
5. Constraint Violators
The greatest players in baseball history are those who significantly exceed the structural limits imposed by their environment.
These individuals produce performance levels that appear statistically extraordinary relative to league norms.
Greatness emerges when a player consistently exceeds the structural constraints imposed by the run-production equilibrium of his era.
Conclusion
Baseball history can therefore be understood as the evolution of a competitive system operating under shifting structural constraints. The nineteenth century, the Deadball era, and the Live Ball expansion each represent distinct run-production environments. By adjusting for those environments, player performance can be interpreted relative to the equilibrium conditions in which it occurred.
In this framework, greatness is not simply the accumulation of statistics. It is the degree to which a player exceeds the structural limits of the scoring environment of his era.
Note on the Run Environment Figure
The run-environment graph included here illustrates long-term fluctuations in scoring across baseball history and confirms several well-documented transitions:
early volatility in the nineteenth century
offensive contraction during the Deadball era
expansion following the Live Ball revolution
These shifts demonstrate that baseball operates within changing structural regimes, reinforcing the need to evaluate performance relative to the scoring environment of the era.
Environmental Value Generation (EVG)
A Simple Cross-Era Metric for Measuring Baseball Dominance
Abstract
Run scoring in baseball varies substantially across historical eras due to changes in rules, equipment, pitching conditions, and strategy. Because of this variation, raw statistics cannot be directly compared across time without adjusting for the run environment.
Environmental Value Generation (EVG) is a simple metric designed to measure player performance relative to the scoring environment in which it occurred. The model combines three components: player dominance relative to league average, workload, and the difficulty of the run-scoring environment.
EVG therefore estimates how much value a player generated above the equilibrium scoring conditions of his era.
1. Model Concept
Baseball performance occurs within a run environment , defined by the average number of runs scored per team per game in a given league and season.
When run scoring is low, offensive production is harder to generate and pitching suppression is more difficult to maintain. When run scoring is high, offensive numbers inflate naturally.
EVG adjusts player performance for these conditions so that players from different historical environments can be compared more directly.
2. Model Components
The EVG model contains three variables.
1. Dominance
Player performance relative to league average.
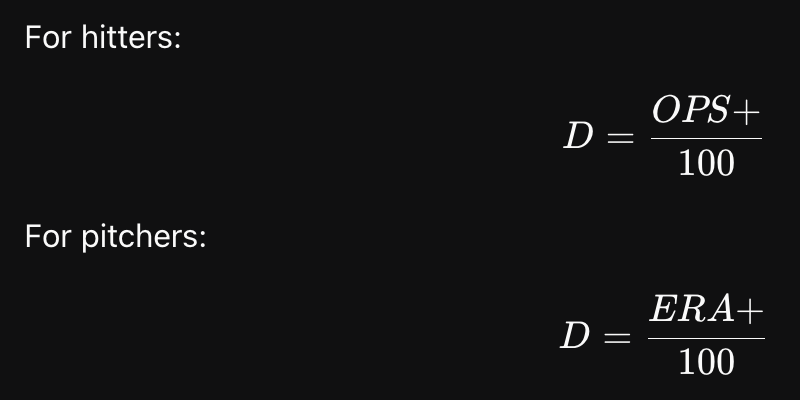
OPS+ and ERA+ are widely used metrics that normalize player performance relative to league average.
2. Workload
Performance sustained over larger playing time carries more value.
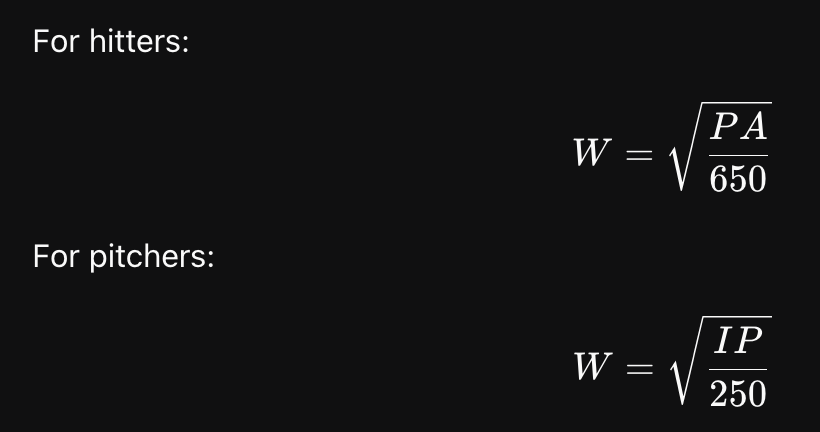
650 plate appearances and 250 innings pitched approximate a full-season workload for elite players.
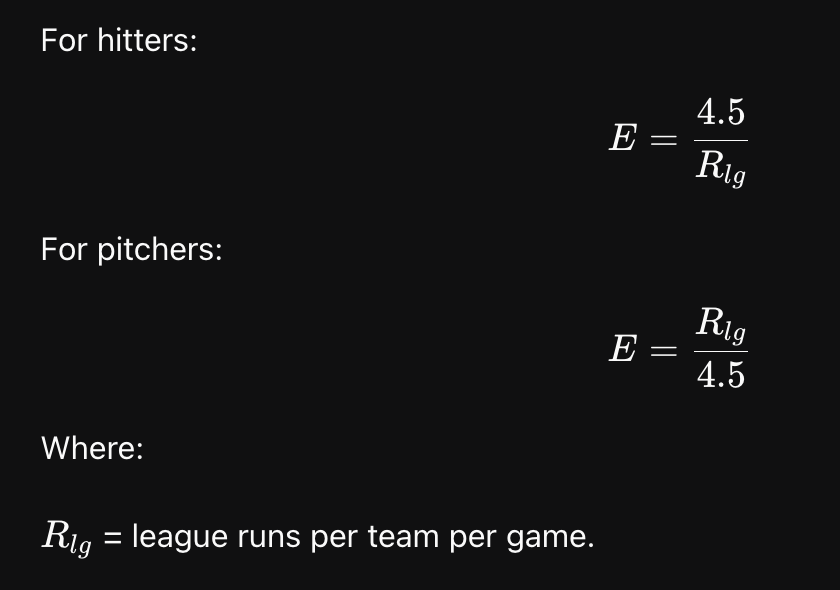
3. Run Environment
Run scoring difficulty is represented by league runs per team per game.
A reference environment of 4.5 runs per team per game approximates the long-term historical average in Major League Baseball.
3. EVG Formula
Hitter EVG

Where:
OPS+ = offensive production relative to league average
PA = plate appearances
Pitcher EVG

Where:
ERA+ = run prevention relative to league average
IP = innings pitched
4. Interpretation
Higher EVG scores indicate players who:
• performed far above league average
• sustained that performance over significant playing time
• did so in difficult run-scoring environments
In this sense, EVG measures dominance above environmental equilibrium.
5. Historical Context
Run environments have fluctuated significantly across baseball history.
Examples include:

Because EVG adjusts for these environments, players from different eras can be evaluated within a consistent framework.
This makes it possible to compare players from very different historical contexts, including early stars such as Dave Orr, Deadball hitters like George Sisler, and power hitters of the Live Ball era such as Babe Ruth.
6. Summary
EVG is a simple metric built from three intuitive factors:
EVG = Dominance x Workload x Environment
By adjusting player performance for the scoring conditions of the league, EVG measures how much value a player generated above the equilibrium run environment of his era.
Expansion and Compression: Environmental Separation and the True Measure of Greatness
Baseball statistics emerge from a competitive system whose equilibrium state is defined by the league run environment. In any given season, the average number of runs scored per team per game represents the baseline energetic condition of the system. Hitters and pitchers operate within that field of equilibrium, and their performances represent attempts either to expand or compress the production of runs.
The greatness of a player therefore cannot be understood solely through raw statistical totals. It must be understood in terms of how strongly a player displaces the system away from its equilibrium state.
Two distinct forms of this displacement exist.
Expansion in a Low-Energy System
When the league run environment is suppressed—such as during the Deadball era—offense becomes structurally difficult to generate. Heavy baseballs, large ballparks, dominant pitching, and strategic emphasis on bunting and contact compress the scoring environment and reduce the natural production of runs.
In such a system, the hitter who generates extraordinary offensive output is not merely accumulating statistics. He is expanding the energetic capacity of a system that resists expansion.
This represents one of the purest forms of offensive dominance. The player must overcome structural resistance embedded in the rules, equipment, and strategic logic of the game itself.
Players such as Honus Wagner and Ty Cobb exemplify this phenomenon. Their offensive production occurred within one of the most suppressed run environments in baseball history, meaning their success represents a significant expansion of output beyond the system’s baseline equilibrium.
Compression in a High-Energy System
The opposite situation also exists. In certain historical periods—most notably the offensive surge of the late 1920s and early 1930s—the baseball system becomes energetically expanded. Improved baseball construction, evolving hitting strategies, and smaller ballparks create conditions in which offense flourishes and run scoring rises dramatically.
In this context, the dominant pitcher performs the inverse act. Rather than expanding the system, he compresses offensive output within an already expanded environment.
This achievement is structurally difficult because the equilibrium state of the system itself favors run production. Suppressing offense in such conditions requires extraordinary command, deception, and physical skill.
The career of Lefty Grove illustrates this phenomenon. Grove dominated the American League during one of the most offensively explosive periods in baseball history. His sustained separation from the league average represents a powerful compression of a high-energy system.
Equilibrium Disruption as the Core Measure of Greatness
These two achievements—expansion in suppressed environments and compression in inflated environments—are mirror expressions of the same underlying phenomenon.
Both represent large deviations from the equilibrium state of the game.
In thermodynamic terms, the league run environment establishes the system’s baseline energy level. Exceptional players are those who produce the greatest disturbances within that system. Great hitters push offensive production above the natural equilibrium, while great pitchers push it below.
The magnitude of this displacement defines the true scale of dominance.
Environmental Separation
Traditional statistics often normalize performance relative to league averages. While this captures separation from contemporaries, it does not fully capture the structural difficulty imposed by the environment itself.
Environmental analysis adds a crucial dimension. It asks not only how far a player separated from the field, but what kind of system the player was operating within.
A hitter who creates offense when scoring is structurally suppressed demonstrates the ability to expand the system beyond its natural limits. A pitcher who suppresses offense during an era of explosive scoring demonstrates the ability to compress a system that resists compression.
Both forms of environmental separation reveal the deepest form of baseball greatness: the ability to alter the equilibrium of the game itself.
The Thermodynamic Structure of Baseball Dominance
When viewed through this lens, baseball history becomes the record of players who most powerfully disrupted the energetic equilibrium of their era.
Hitters such as Babe Ruth expanded the offensive capacity of the sport to unprecedented levels. Deadball hitters like Wagner and Cobb generated offense in systems that naturally suppressed it. Pitchers such as Grove demonstrated the ability to suppress run production even when the structure of the game favored hitters.
These players were not merely productive. They were equilibrium violators —individual forces capable of pushing the competitive system of baseball beyond its normal operating state.
Baseball greatness is not simply the accumulation of statistics. It is the magnitude of a player’s disturbance of the run-production equilibrium of his era.
Baseball as a Dynamic Equilibrium System: Modeling Greatness as Structural Disturbance
The preceding analysis suggests that baseball is best understood not merely as a collection of individual performances, but as a competitive system operating around a shifting equilibrium of run production. Each historical era establishes its own baseline scoring level, determined by the structural conditions of the game—rules, equipment, pitching mechanics, ballparks, defensive skill, and strategic conventions.
Within this system, hitters and pitchers act as opposing forces that alternately expand or compress the production of runs. Most players operate close to the equilibrium conditions of their era, with performance fluctuating near the league baseline. Exceptional players, however, generate outcomes that deviate dramatically from those conditions. These individuals function as perturbations of the run-production system, pushing the game away from its natural operating state.
Metrics such as OPS+ and ERA+ already measure performance relative to league equilibrium by expressing production as a multiple of league average. The Environmental Value Generation (EVG) model extends this logic by incorporating two additional factors: workload and environmental difficulty. In doing so, EVG estimates the total disturbance a player generates relative to the structural conditions of the environment in which that performance occurred.
Under this framework, greatness is not simply the accumulation of impressive statistics. It is the magnitude of a player’s ability to exceed the structural constraints imposed by the scoring equilibrium of his era.
At its deepest level, this interpretation reframes baseball greatness as a form of constraint violation. Every historical environment imposes limits on performance through the competitive balance and structural design of the sport. Great players are those who exceed those limits. Hitters who generate extraordinary offense in suppressed environments expand the energetic capacity of the system, while pitchers who dominate in high-scoring eras compress systems that naturally favor run production.
Viewed in this way, baseball history becomes the record of individuals who most powerfully disrupted the equilibrium of their era. Their achievements represent moments when the structure of the game was pushed beyond its normal operating state. Greatness, therefore, is not merely statistical superiority; it is the magnitude of a player’s disturbance of the run-production equilibrium under the structural resistance of the environment in which he played.
Appendix
Additional passages & variants
Additional passages / variants — from substack:davidbussellarchive: Expansion and Compression: Environmental Separation and the True Measure of Greatness (2026-03-13)
Audit note (2026-10-19): the passages below occur in this source but were not found elsewhere in the archive; appended so that the source is fully represented. Ellipses […] mark where already-present text was skipped.
not simply the accumulation of statistical achievements. It is the capacity of a player to generate the largest deviation from the structural equilibrium of the game