Baseball Climatology: Production and Mitigation Under Run Climate
Baseball Climatology: Production and Mitigation Under Run Climate
Baseball Climatology
Production and Mitigation Under Run Climate
Abstract
Baseball performance does not occur in a vacuum. It unfolds within a measurable scoring environment — a run climate.
This paper formalizes a clean, era-consistent framework built on a single principle:
Run climate is the difficulty field.
Hitters and pitchers are evaluated not by separation from league average, but by their proportional interaction with the scoring atmosphere itself.
The result is a symmetrical, dimensionless model that measures:
Production share (hitters)
Suppression share (pitchers)
without auxiliary “power difficulty” multipliers or era-adjustment layers.
I. The Central Principle
Let:
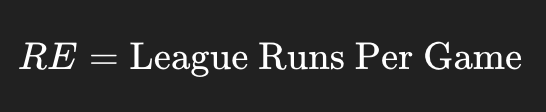
This is the run climate.
It represents the scoring density of the era — the atmospheric pressure under which all players operate.
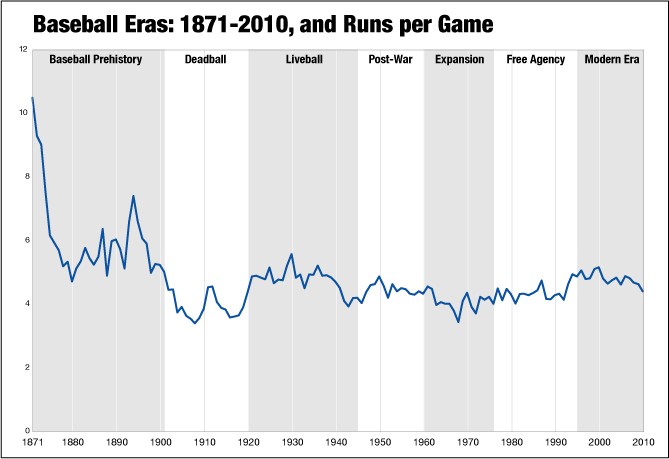
Deadball baseball: thin scoring climate
1930 National League: high-density scoring climate
1968: suppressed scoring climate
Late 1990s: expanded scoring climate
In this framework:
Difficulty is defined as the scoring climate itself.
No additional structural adjustments are required.
II. The Two Operators Within the Climate
Baseball performance reduces to two behaviors:
Production — creation of runs
Mitigation — prevention of runs
These are mirror operations inside the same field.
III. The Core Equations
A. Pitchers — Suppression Share
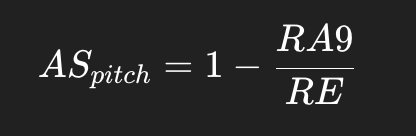
Where:
(RA9) = Runs allowed per 9 innings
(RE) = League runs per game
Interpretation
This measures:
The percentage of the run climate suppressed while the pitcher is on the mound.
Example:
If:
(RE = 5.08)
(RA9 = 3.05)
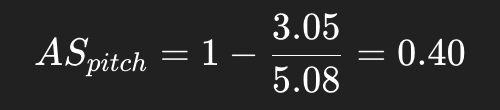
The pitcher suppresses 40% of the scoring climate.
This formulation:
Scales automatically across eras
Is dimensionless
Requires no league-average comparison
Embeds environmental difficulty directly
B. Hitters — Production Share
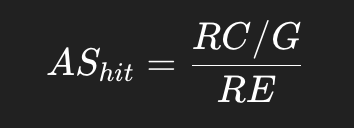
Where:
(RC/G) = Runs created per game
(RE) = League runs per game
Interpretation
This measures:
The percentage of the run climate personally generated per game.
Example:
If:
(RE = 4.65)
(RC/G = 1.00)
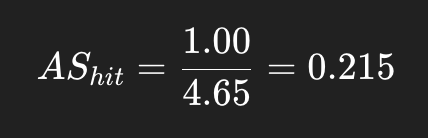
The hitter generates 21.5% of the total scoring climate per game.
Again:
No additional difficulty multiplier
No power adjustment
Climate is already the denominator
IV. Why This Resolves Era Difficulty
Common debates:
“Live-ball was easier.”
“Deadball was harder.”
“Power eras inflate numbers.”
Under climatology, these disputes collapse.
If run climate rises:
Suppression becomes structurally harder (higher baseline sky).
Production becomes proportionally diluted (larger denominator).
The environment self-normalizes.
Difficulty is not added later — it is built into the field.
V. Conceptual Difference from OPS+ and ERA+
Traditional metrics such as OPS+ and ERA+ measure:
Separation from league average.
This model measures:
Share of total scoring environment influenced.
It shifts from deviation analysis to field interaction analysis.
OPS+ asks:
- How far above average?
Climatology asks:
- What fraction of the total atmosphere did you bend?
These are philosophically and mathematically distinct.
VI. Symmetry of the System
The equations are structurally mirrored:
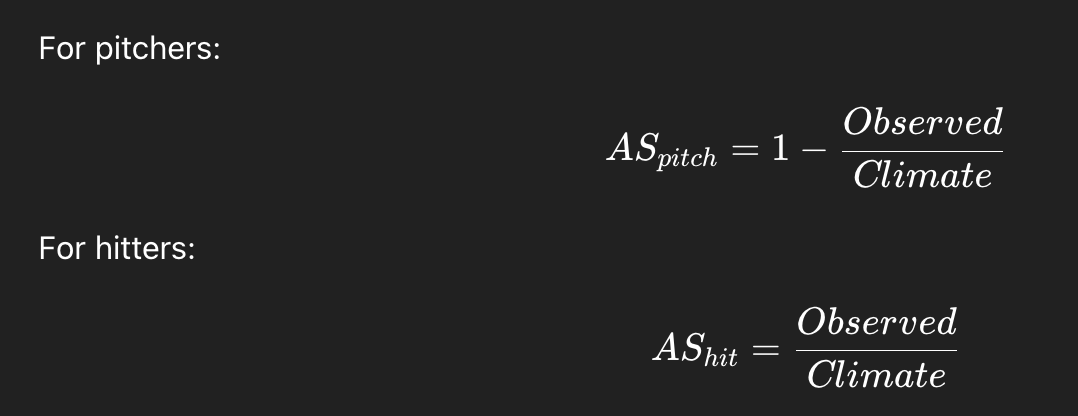
One subtracts from the field.
One adds to the field.
This symmetry gives the framework internal coherence and conceptual elegance.
VII. Implementation Standards
The integrity of the model depends on two methodological requirements.
1. Climate Definition
Use league-specific RE values.
Avoid cross-league mixing without defined climates.
Prefer season-level RE or appropriately weighted rolling windows.
Climate accuracy is foundational.
2. Proper Weighting
For multi-season evaluation:
Pitchers: IP-weighted RA9
Hitters: Game- or PA-weighted RC/G
Unweighted seasonal averages distort climate share.
VIII. Career Impact Extension
The above formulas measure rate impact.
To evaluate career magnitude:

Where exposure is:
Innings pitched (pitchers)
Games or plate appearances (hitters)
This integrates both efficiency and duration.
IX. Structural Interpretation
Under climatology:
Deadball baseball is a low-density scoring atmosphere.
1930 is a high-density atmosphere.
1968 is a suppressed atmospheric field.
Players are agents operating within those skies.
Some generate climate.
Some suppress it.
The field remains the constant reference.
X. Conclusion
Baseball performance is best understood as interaction with a measurable scoring climate.
The governing statement of the model is simple:
Dominance = Run Impact Normalized by Run Climate.
No secondary power multiplier is required.
No era-difficulty addendum is needed.
The sky is already encoded in RE.
By defining difficulty as climate itself, baseball history becomes a coherent climatology — a study of production and mitigation within shifting atmospheric conditions.
This framework provides:
Era consistency
Structural symmetry
Conceptual clarity
Mathematical simplicity
It reduces complexity without sacrificing rigor.
And it grounds dominance not in comparison to average, but in proportional control of the environment itself.
I. Career Formula for Pitchers
Climate Suppression Accumulation
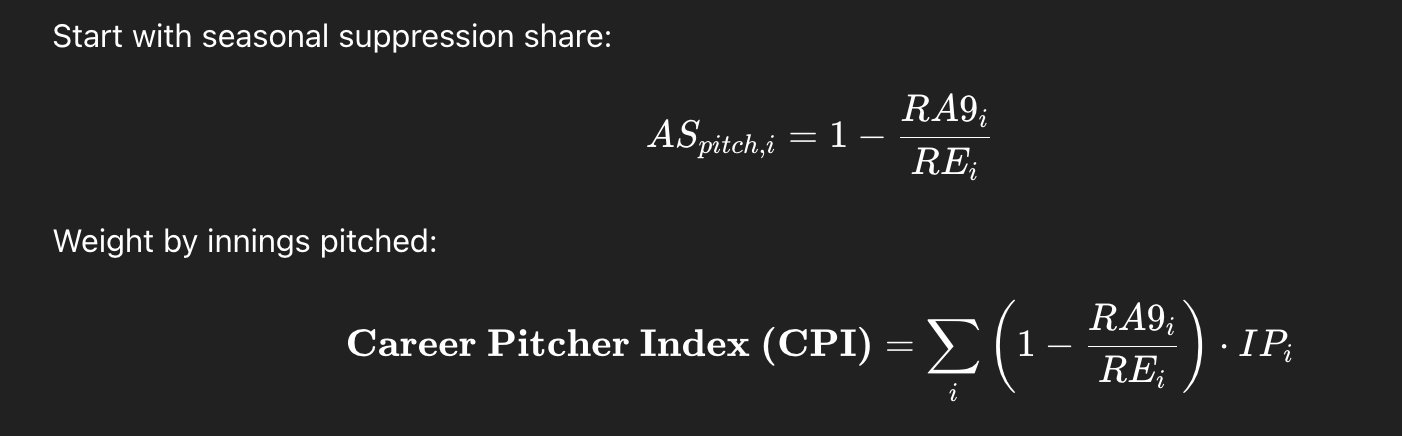
What this measures
It measures:
Total climate suppressed across the pitcher’s career.
Each inning is weighted by how much of that season’s scoring atmosphere was suppressed.
A pitcher who suppresses 40% of climate for 250 IP adds more than one who suppresses 40% for 120 IP.
It scales naturally with:
Era climate
Volume
Efficiency
It is additive, stable, and dimensionally coherent.
II. Career Formula for Hitters
Climate Production Accumulation
Start with seasonal production share:
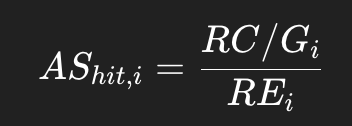
Weight by games (or plate appearances for greater precision):

Or using plate appearances:

What this measures
It measures:
Total fraction of scoring climates personally generated across a career.
Each game adds:
Share of the sky bent
Multiplied by time spent inside that sky
III. Unified Structural View
Both formulas follow the same architecture:

Where:
Climate Share =
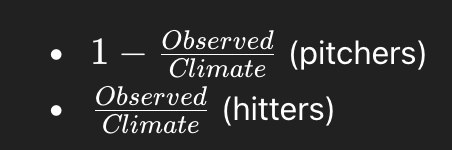
Exposure =
IP (pitchers)
G or PA (hitters)
IV. Why This Is Elegant
It preserves symmetry.
It accumulates real atmospheric impact.
It avoids league-average anchoring.
It scales automatically with era climate.
It integrates peak and longevity in a single expression.
There are only two equations because baseball only has two operators:
Suppression
Generation
Both are measured as proportional interaction with a defined climate field.
V. The Final Clean Pair
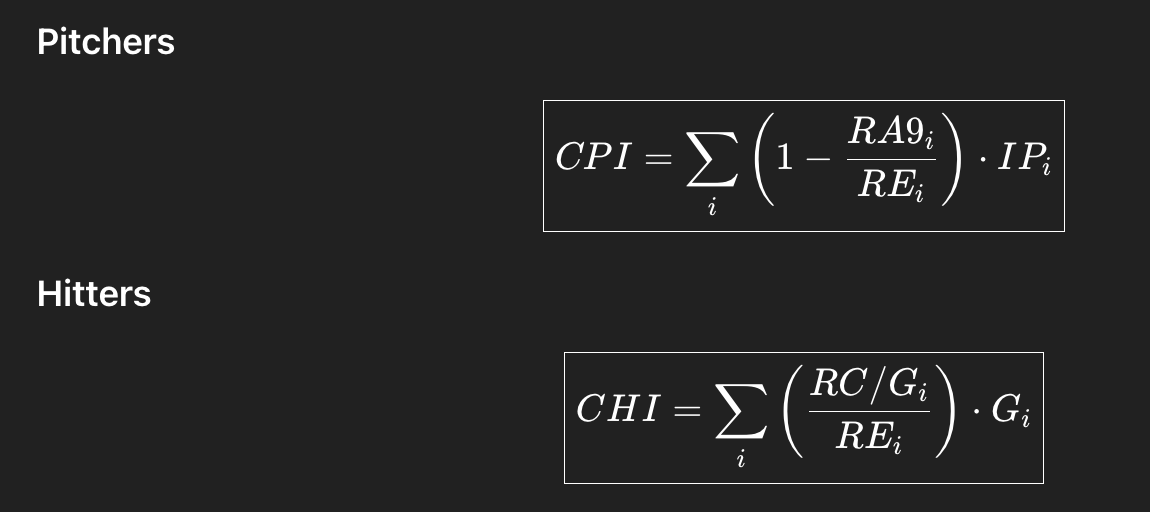
That is the complete climatology career engine.
Nothing extra is needed.
Addendum: Unified Scale
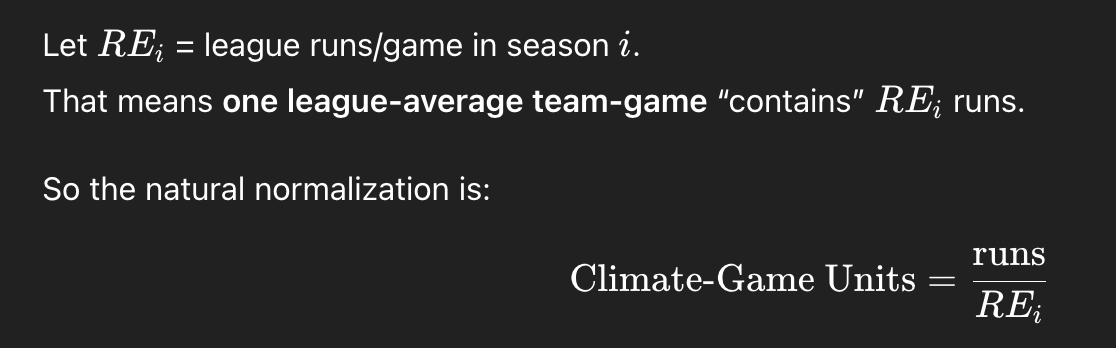
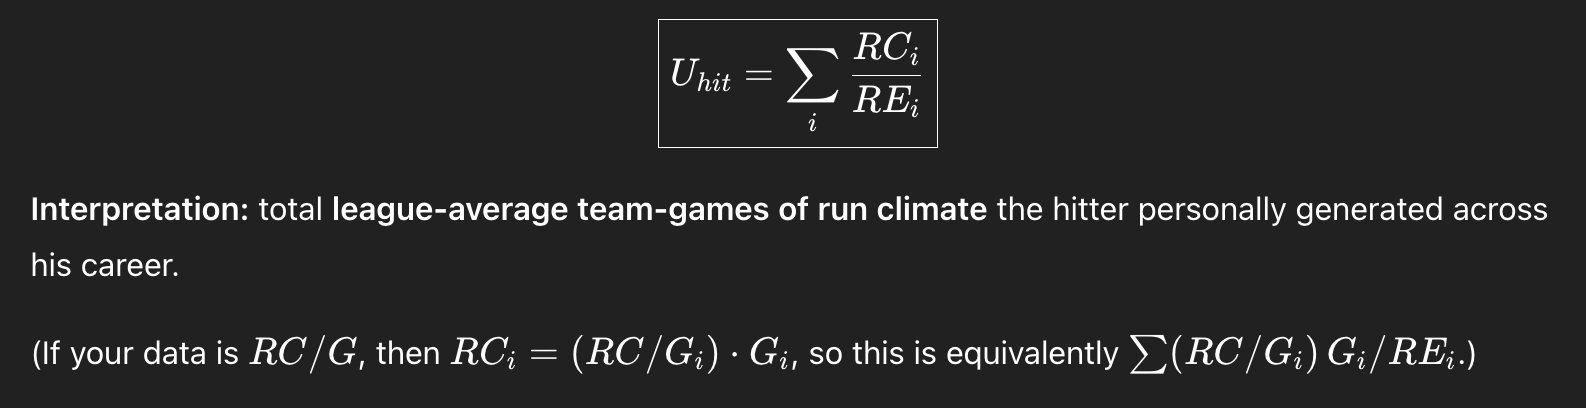
To put both hitters and pitchers into the same unit :
“team-games of run climate.”
(i.e., how many league-average team-games worth of runs you created or prevented, after normalizing by that season’s RE.)
That gives one axis where hitters generate climate and pitchers suppress climate , both measured in the same currency.
Unified Scale Unit
1) Unified Career Score for Hitters
Use total runs created (or any run-value metric in runs), normalized by the season climate:
2) Unified Career Score for Pitchers
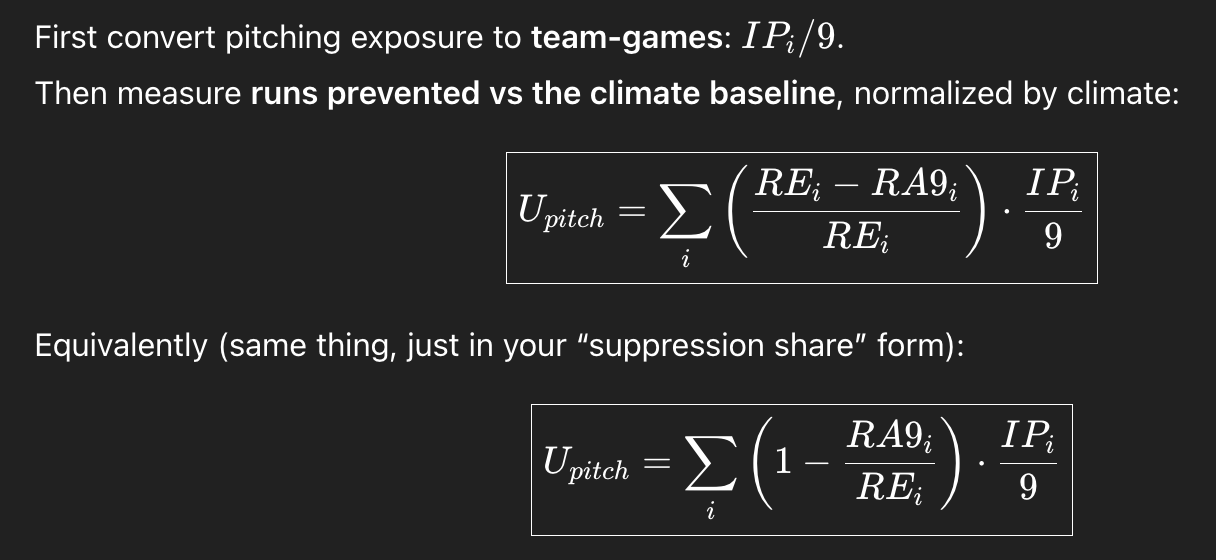
Interpretation: total league-average team-games of run climate suppressed across the pitcher’s career.
What you get
Both (U_{hit}) and (U_{pitch}) live on one clean scale:
Positive = added (hitters) / prevented (pitchers) climate
Pitchers can go negative (worse than climate); hitters typically won’t unless you use a runs-above-baseline variant.