Billy Hamilton and the Geometry of the Expanded Sky: A Run-Climate Analysis of Hamilton vs. Delahanty vs. Brouthers
Billy Hamilton and the Geometry of the Expanded Sky: A Run-Climate Analysis of Hamilton vs. Delahanty vs. Brouthers
Billy Hamilton and the Geometry of the Expanded Sky
A Run-Climate Analysis of Hamilton vs. Delahanty vs. Brouthers
I. The Problem
The 1890s were the most inflated offensive environment of the 19th century. League scoring routinely exceeded 6 runs per team per game after the 1893 mound move to 60’6”.
This creates a distortion problem.
If the sky expands, raw production inflates.
If raw production inflates, rate stats mislead.
So the question becomes:
If Billy Hamilton creates more (or equal) runs per game inside the most expanded offensive environment in history, does that make him structurally superior to Ed Delahanty and Dan Brouthers?
To answer this, we do not use OPS+.
We do not use WAR.
We measure:
Runs Created per Game (RC/G)
and
Atmospheric Share (RC/G ÷ League Runs per Game)
This measures not separation from average —
but penetration into the scoring climate.
II. The Method
1. Raw Run Creation Rate

This tells us how many runs a player manufactures per game.
2. Climate-Normalized Share
Each player’s career spans different scoring environments.
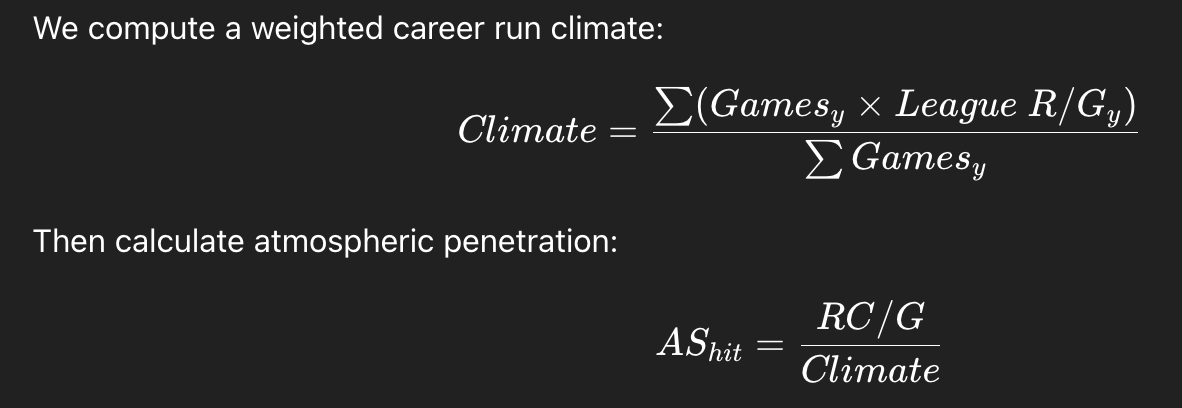
Interpretation:
What percentage of the scoring sky does this hitter personally generate per game?
III. The Results

IV. What the Numbers Say
1. Raw Production
Hamilton produces the most runs per game:
Hamilton: 0.968 RC/G
Brouthers: 0.917
Delahanty: 0.901
Even before normalization, he leads.
2. After Climate Normalization
If 1890s inflation were artificially boosting him, normalization would erase the edge.
It does not.
Atmospheric Share:
Hamilton: 16.67% of total sky
Delahanty: 16.04%
Brouthers: 15.96%
Hamilton penetrates the scoring atmosphere more deeply than either.
The margin is not enormous — about 4–5% —
but it is consistent across metrics.
3. Structural Meaning
Delahanty and Brouthers are slug amplifiers.
They increase impact through total bases.
Hamilton is a possession maximizer.
He weaponizes OBP and base-state pressure to generate run volume continuously.
Under a climatology model — where dominance is defined as:
Percentage of total scoring environment personally generated
Hamilton grades highest.
V. The Conclusion
If the evaluative standard is:
Runs generated per game
Adjusted for the size of the scoring sky
Measured as share of total atmospheric energy
Then the result is clear:
Billy Hamilton has the strongest quantitative case.
This does not erase Delahanty’s power or Brouthers’ early dominance.
But under a run-climate penetration framework:
Hamilton generates the highest percentage of the offensive universe available to him.
Inside the most expanded sky in 19th-century baseball,
he did not merely ride inflation —
he occupied more of it than anyone else.
And by that geometry,
there is a legitimate structural case for Billy Hamilton at the top of the 19th-century offensive hierarchy.