Constraint Resistance and the Difficulty of Hitting: A Run-Environment Model for Career .340 Hitters
Constraint Resistance and the Difficulty of Hitting: A Run-Environment Model for Career .340 Hitters
Constraint Resistance and the Difficulty of Hitting: A Run-Environment Model for Career .340 Hitters
Baseball analysis has long relied on normalization.
OPS+, wRC+, and similar frameworks attempt to adjust performance relative to league conditions. But these systems operate by flattening context—transforming fundamentally different environments into a single comparable scale.
That approach obscures something more essential:
The difficulty of hitting is not relative. It is structural.
It emerges from the interaction between a hitter’s rate production and the underlying run-scoring system in which that production occurs.
This model defines that interaction directly.
Defining the System
The foundation is a continuous runs-per-game curve across baseball history.
Rather than dividing the game into discrete eras, the model treats run scoring as a dynamic constraint field —a system that expands and contracts over time.
At the center of this system sits an equilibrium point:

This corresponds to the late-1920s/early-1930s offensive environment, where:
scoring bandwidth is maximized
volatility is low
system slope is minimal
This is not an arbitrary benchmark. It represents the point at which the structure of the game most naturally supports the full expression of hitting.
The Three Components of Difficulty
To measure difficulty, three independent elements are required:
1. Rate Form (RO)
A hitter’s production must be expressed in pure rate terms:
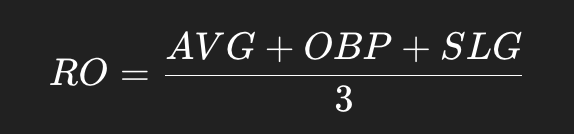
This preserves the geometry of hitting:
AVG → conversion (contact)
OBP → access (discipline)
SLG → force (power)
No counting stats are used. Only sustained rate expression.
2. Run Environment (RD)
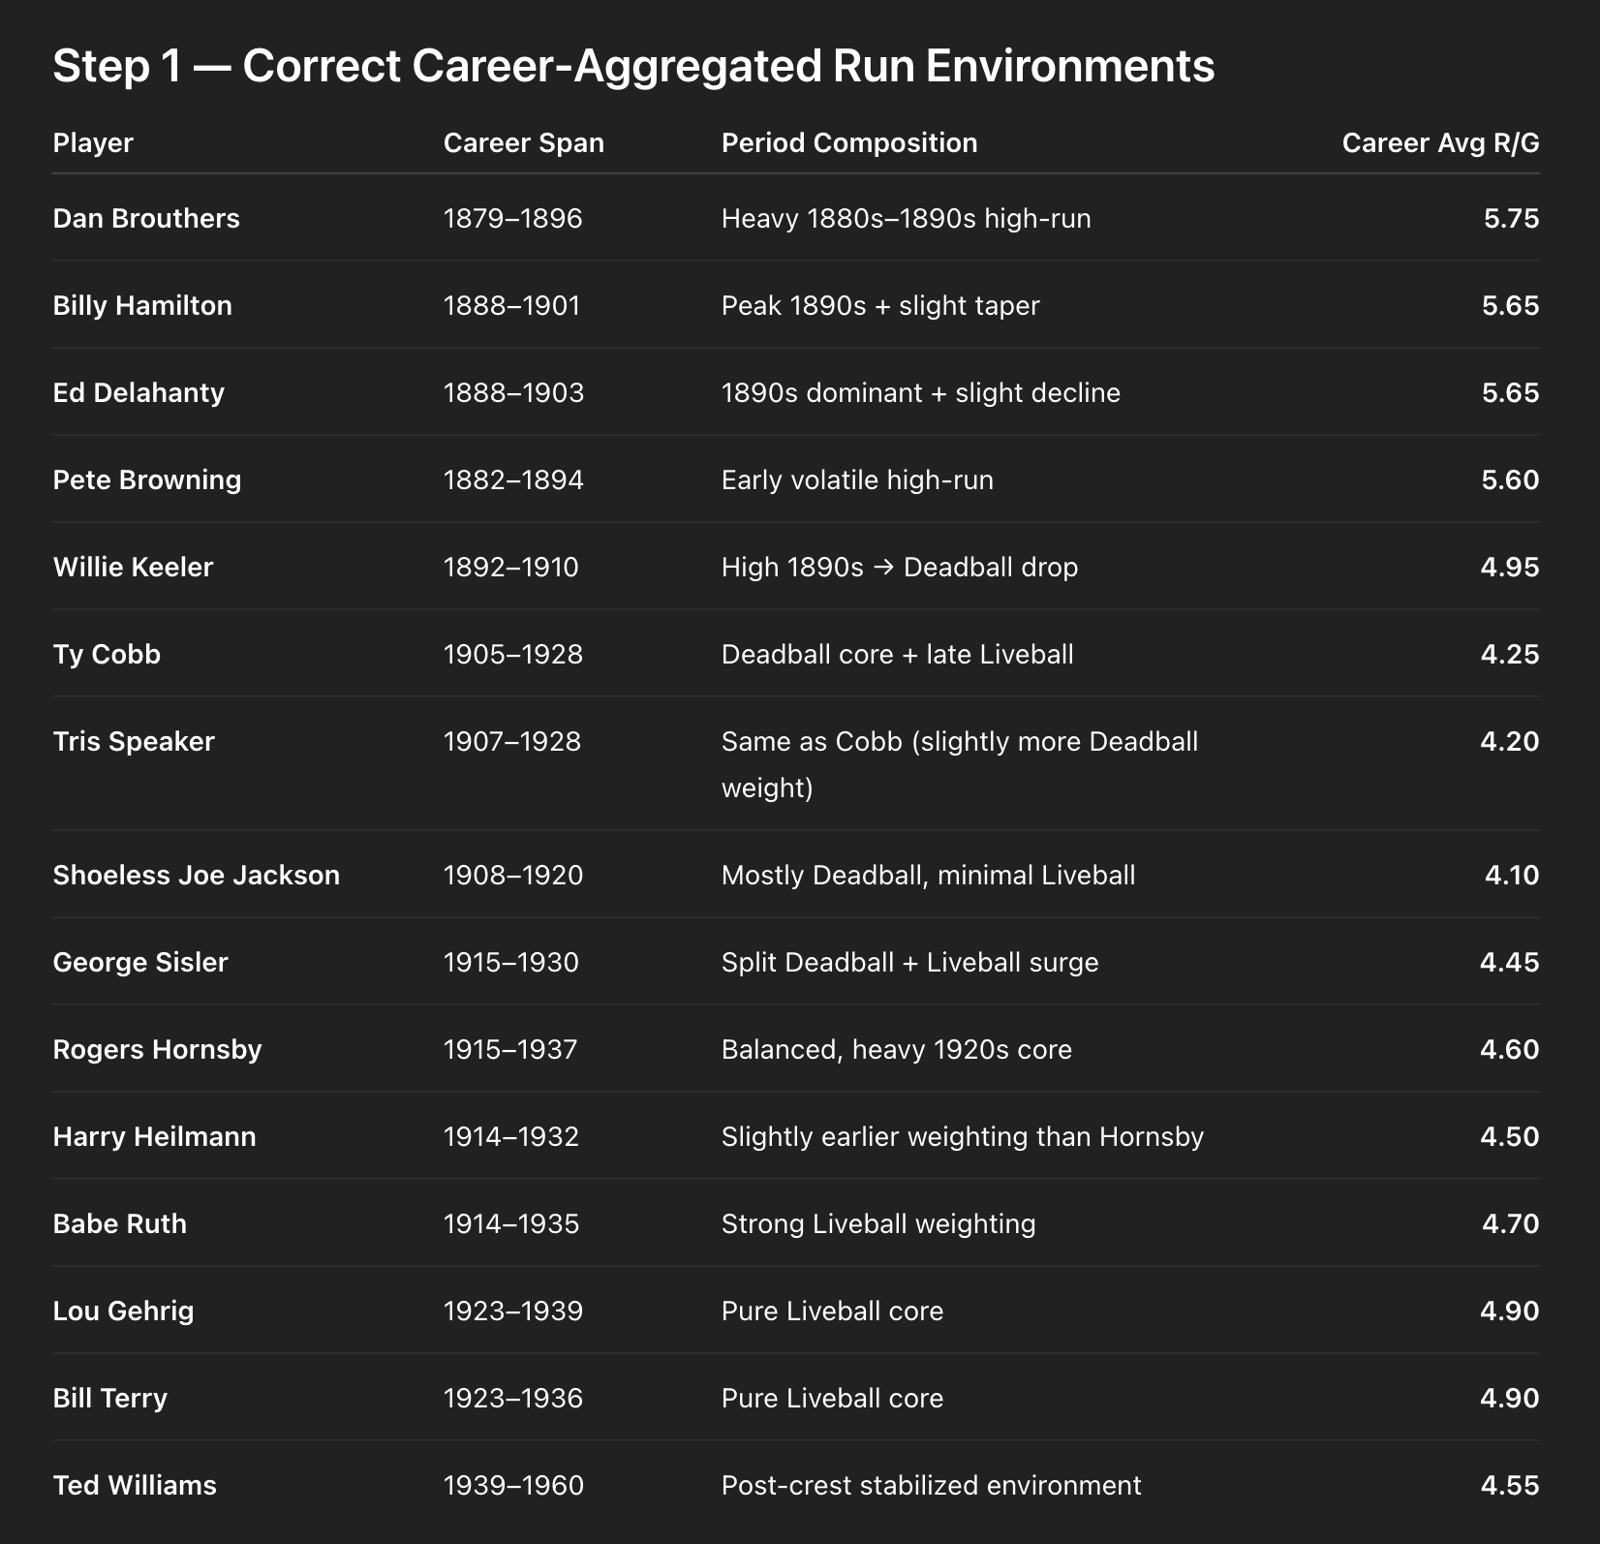
Each hitter is assigned a career-aggregated run environment , constructed by averaging league runs per game across every season of his career.

This produces a direct measure of environmental constraint:
Low-scoring systems (≈4.0 R/G) → higher difficulty
High-scoring systems (≈5.5–5.8 R/G) → lower difficulty
This step resolves a common distortion: careers that span multiple environments are not reduced to a midpoint or a label, but treated as full-system exposures.
3. Structural Resistance (SR)
The run curve also contains local structure:
distance from equilibrium
volatility in nearby seasons
slope (system transition pressure)
These are captured in a Constraint Resistance Score (CRS) , then applied as:
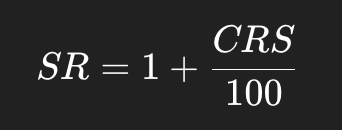
This ensures that difficulty reflects not just where a player existed on the curve, but how stable or unstable that position was.
Final Model
The full difficulty score is:

This produces a single value:
The difficulty of achieving a given rate line within the actual structure of baseball’s run-scoring system
Results
When applied to the population of .340+ batting average hitters, a clear structure emerges.
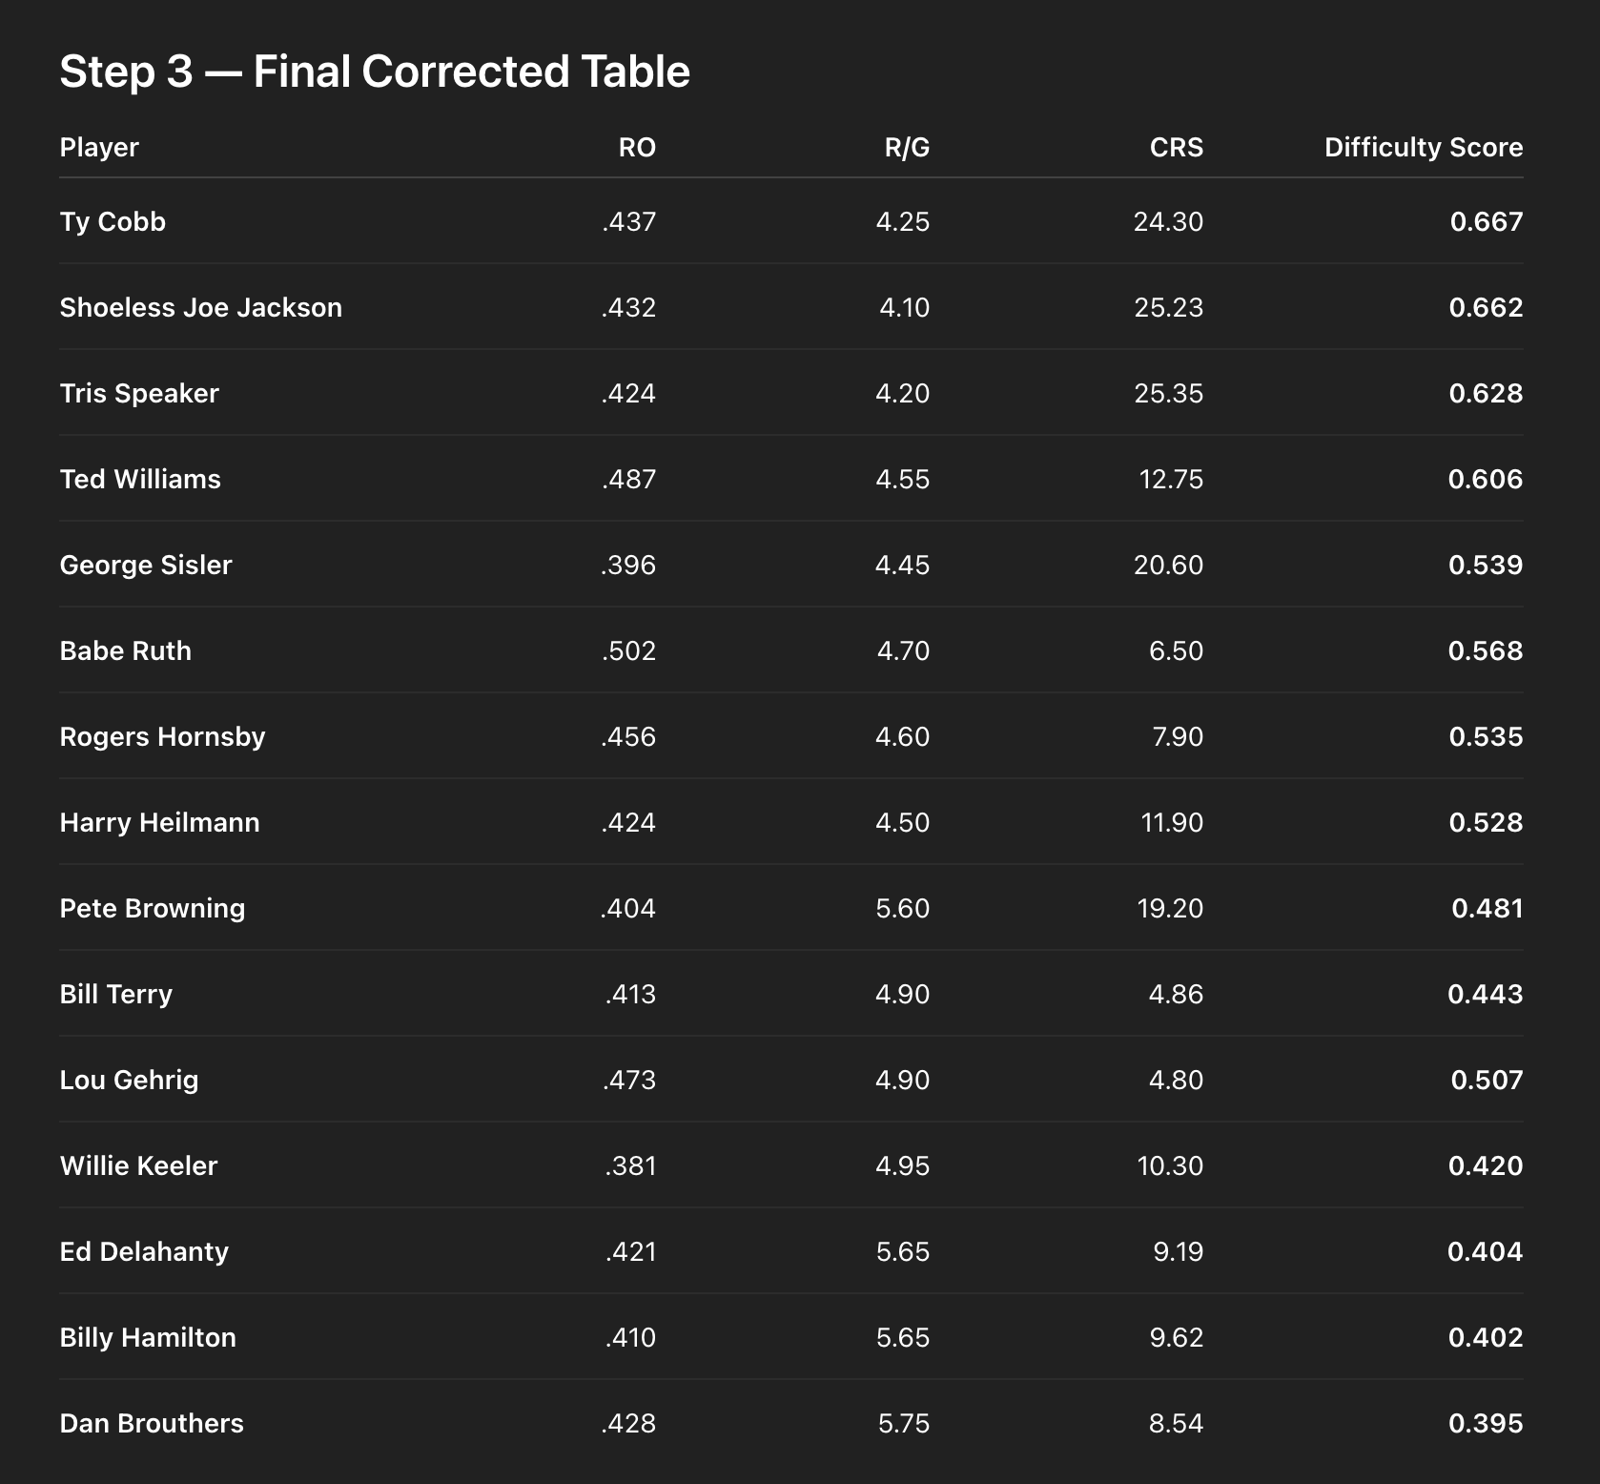
Step 4 — Clean Ranking (Corrected)
Maximum Difficulty
Cobb
Jackson
Speaker
High Difficulty
Williams
Ruth
Transitional
Sisler
Hornsby
Heilmann
Moderate
Browning
Terry
Gehrig
Lowest Difficulty (High-run alignment)
Keeler
Delahanty
Hamilton
Brouthers
Maximum Difficulty — Deadball Constraint Core
Ty Cobb
Tris Speaker
Shoeless Joe Jackson
These hitters combine:
high rate production
low run environments (~4.0 R/G)
high structural resistance
They represent:
The complete hitter expressed under maximum constraint.
High Difficulty — Post-Equilibrium and Power Offset
Ted Williams
Babe Ruth
These players operate outside perfect alignment:
Williams in a reduced post-1930 environment
Ruth with extreme power expression that offsets structural ease
Transitional Class
George Sisler
Rogers Hornsby
Harry Heilmann
These careers span multiple system states:
declining Deadball conditions
rising Liveball conditions
Their difficulty reflects movement across the curve , not residence within a single zone.
Equilibrium Zone — Structural Alignment
Lou Gehrig
Bill Terry
These hitters sit closest to:
the equilibrium run environment (~4.9 R/G)
minimal CRS
low volatility
They represent:
The most complete realization of hitting under minimal structural resistance.
This is not a claim of superiority. It is a statement of alignment:
Their production occurs where the system most naturally allows it.
Low Difficulty — High-Run 19th Century Environments
Dan Brouthers
Billy Hamilton
Ed Delahanty
Pete Browning
These players operated in:
elevated run environments (~5.5–5.8 R/G)
moderate structural resistance
Their difficulty scores reflect:
High system bandwidth—conditions more permissive to offensive expression.
What the Model Shows
Three core conclusions emerge:
1. Difficulty is structural, not relative
It is not defined by comparison to peers, but by:
The relationship between performance and system capacity.
2. The Deadball era is the true constraint apex
The lowest run environments combined with high resistance produce:
The hardest conditions under which complete hitting has ever been expressed.
3. The late-1920s/early-1930s form an equilibrium zone
This period is not just historically offensive.
It is structurally distinct:
high run bandwidth
low instability
minimal transition pressure
This creates the conditions for:
The cleanest and most complete realization of the hitting system.
Final Principle
The model resolves hitting into a single interaction:
Difficulty = Rate Form × Environmental Constraint × Structural Resistance
And from that:
Baseball history is not a sequence of eras.
It is a continuous constraint system within which different forms of hitting become possible—or impossible—at different points in time.