Dave Orr: Hit Density and the Structure of the Game
Dave Orr: Hit Density and the Structure of the Game
Dave Orr: Hit Density and the Structure of the Game
One of the simplest statistics in baseball—hits per game —reveals something surprisingly deep about the nature of offensive greatness. By dividing total hits by games played, we measure how frequently a hitter manifests as a successful offensive event within the temporal structure of the game itself. The result isolates what might be called hit density : the rate at which a player produces the most fundamental offensive outcome in baseball.
Formally:
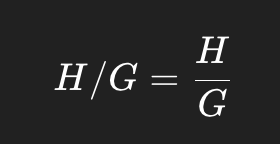
Unlike cumulative counting statistics, this measure captures how often a hitter appears as a hit within the unfolding rhythm of each game.
When we compute this ratio for the great contact hitters of the pre-modern game, a striking pattern emerges.
Top 10 Hit Density (Pre-Modern Era)
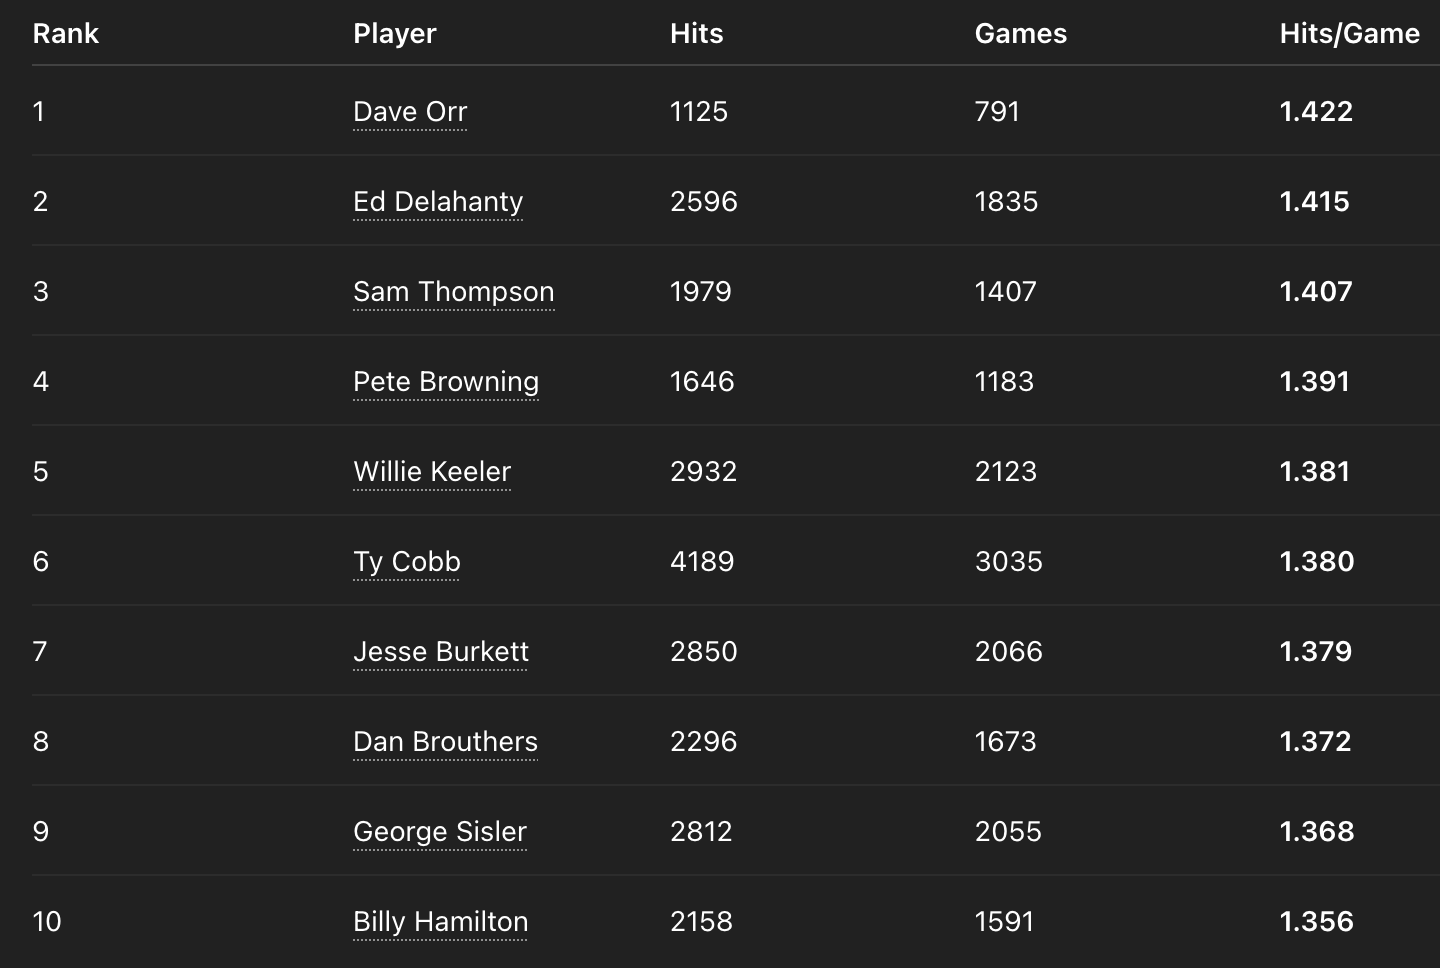
The remarkable feature of this distribution is how tightly clustered it is. The greatest contact hitters in baseball history fall within an extremely narrow range:
1.36 to 1.42 hits per game
This narrow band suggests that baseball imposes a natural ceiling on sustained hit production.
The Structural Limit of Hit Production
Hits per game is not an isolated statistic. It emerges from the interaction of two underlying variables:
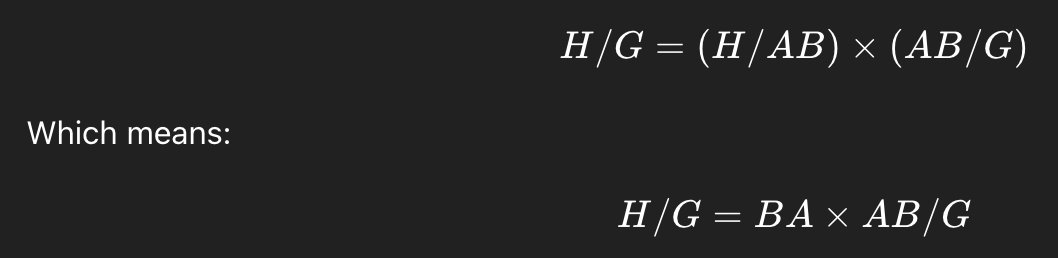
Hit density therefore reflects two forces:
Batting average (contact success)
At-bats per game (opportunity within the structure of play)
Both of these variables are tightly constrained by the architecture of baseball itself.
Elite contact hitters rarely maintain career averages outside a narrow band around .330–.360. At the same time, the structure of the game limits opportunity. Because each inning contains three outs and batting order cycles are finite, most everyday players accumulate roughly 3.8–4.2 at-bats per game.
When these two constraints are multiplied together, the result produces a natural ceiling for sustained hit density.
For example:

That number lies almost exactly at the upper limit observed in the historical data.
In other words, the geometry of baseball itself compresses the range of possible hit density.
Why the Differences Are So Small
This structural compression explains why the separation between the greatest contact hitters appears minimal.
The difference between the highest and lower end of the elite band is roughly:

Per game, this difference is almost imperceptible. But across a full career the effect accumulates.
Over a 2,000-game career:

Thus what appears to be a tiny difference in rate can amount to nearly two hundred hits over time —the difference between a 2800-hit career and a 3000-hit career.
Nevertheless, the overall spread remains small because all of these hitters are operating near the structural ceiling of the game.
Dave Orr as a Limit Case
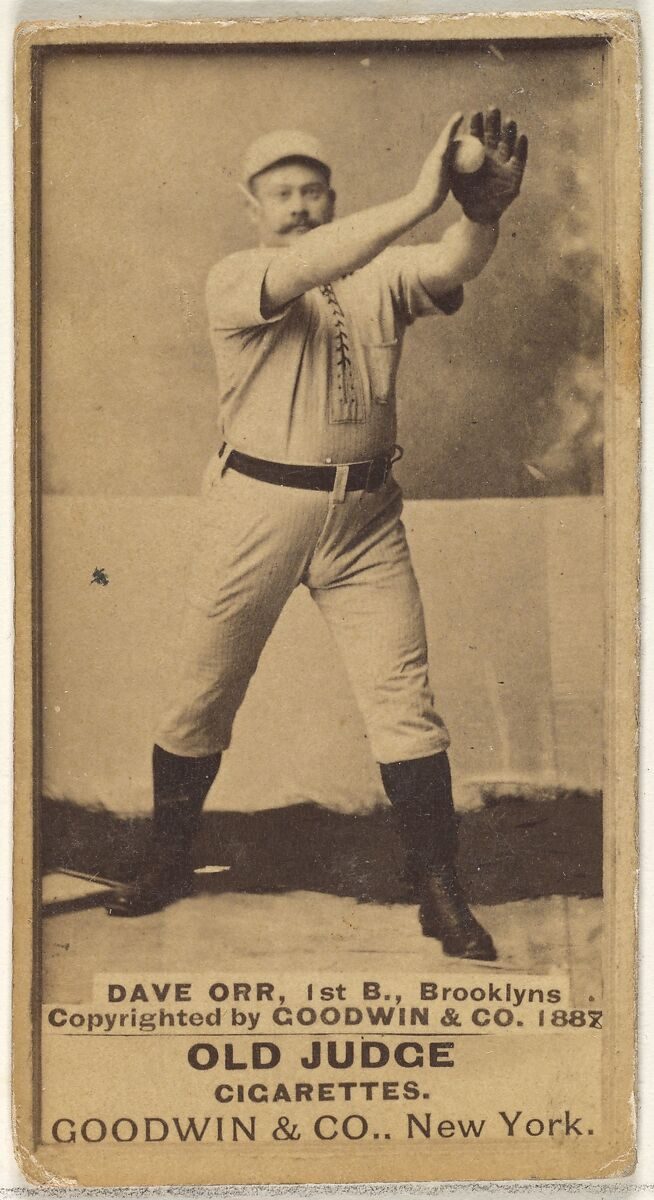
Within this compressed band, the position of Dave Orr becomes especially intriguing.
Orr’s career hit density of 1.422 hits per game places him at the very top of the observed range. Yet he achieved this rate across only 791 games , far fewer than most other players on the list.
If his rate is extrapolated to a career of roughly 2,000 games, it produces approximately 2,840 hits , almost exactly the total accumulated by Jesse Burkett over his much longer career.
This comparison illustrates an important point: the difference between these players lies less in their underlying contact ability than in career length and opportunity. Orr’s offensive signal is simply compressed into a shorter window of time.
Contact Greatness as a Compressed Distribution
The clustering of these hitters reveals something fundamental about baseball history. Contact-based offensive greatness does not produce wide statistical separation. Instead, the greatest hitters of the pre-modern era converge tightly near the structural ceiling imposed by the game itself.
Where power hitters later create enormous statistical gaps through home run production, the contact archetype operates within a narrow band defined by batting average and opportunity.
Hits per game therefore exposes a deeper truth about offensive performance: the greatest contact hitters are distinguished not by vast statistical separation, but by their ability to operate consistently at the upper boundary allowed by the structure of the game.
At that boundary—where batting average and opportunity converge—lies the narrow historical band of roughly 1.36 to 1.42 hits per game , within which some of the most revered hitters in baseball history reside.