Extreme Skies: How Offensive Inflation Reshapes the Meaning of 19th-Century Greatness; The Emergence of the Apex .2 Band of Production in the Deadball Era Onward
Extreme Skies: How Offensive Inflation Reshapes the Meaning of 19th-Century Greatness; The Emergence of the Apex .2 Band of Production in the Deadball Era Onward

Extreme Skies
How Offensive Inflation Reshapes the Meaning of 19th-Century Greatness
Baseball history is not played under a single sky.
It is played under atmospheres — shifting, compressing, inflating climates of run production that fundamentally alter what dominance means.
The late 19th century is the most misunderstood of those skies.
Modern readers encounter the 1880s–1890s statistical record and see excess:
League batting averages over .300
Teams scoring 6–7 runs per game
Individual seasons with 190+ runs scored
The reflex is discounting. Inflation implies distortion. Distortion implies lesser competition.
But that reflex misunderstands the architecture of dominance.
The question is not whether the sky was inflated.
The question is what it meant to dominate within it.
I. Declaring the 19th-Century Sky
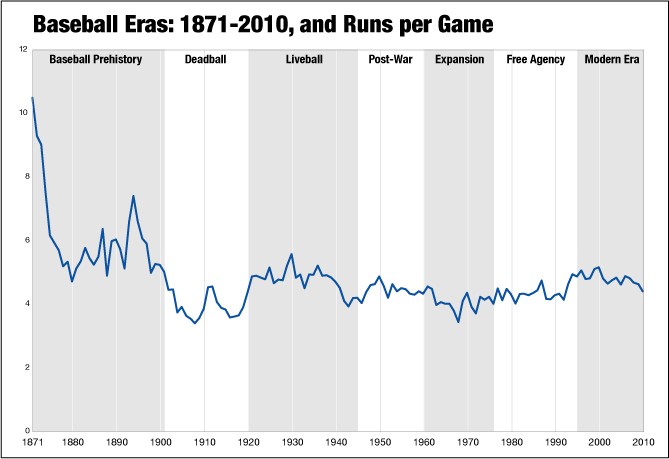
Using the full run-environment curve from 1871–1900, the late-century equilibrium band (1888–1901) sits materially above Deadball and even above the early Live-Ball period.
The 1894 spike peaks above 7 runs per game, but the center of gravity across the period stabilizes near:

This is not a cherry-picked spike year.
It is the actual atmospheric average across the competitive band in which:
Billy Hamilton operated (1888–1901)
Dan Brouthers operated (1879–1896)
This sky is:
Higher than Deadball (3.72)
Higher than Ruthian (5.08)
Structurally volatile
It is an inflationary environment.
But inflation does not eliminate dominance. It compresses it.
II. The Hitting Module
Using the defined atmospheric model:
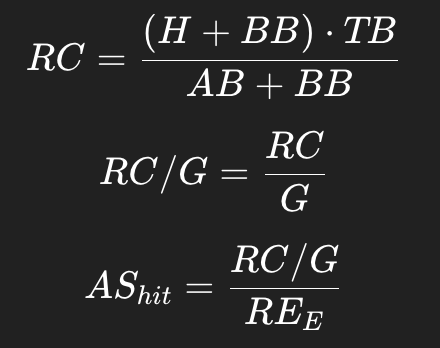
Atmospheric Share (AS_hit) measures:
The fraction of the era’s scoring atmosphere generated per game.
This corrects the illusion created by inflated raw totals.
III. Billy Hamilton Under the Victorian Sky
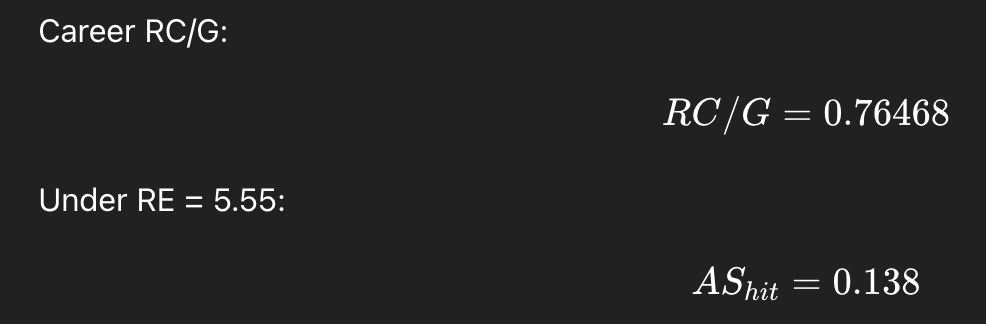
Hamilton generates roughly 13.8% of the era’s scoring atmosphere per game.
In an inflated sky, that is meaningful — but it is not transcendent.
This is why Hamilton feels historically strong but not mythic in unified comparison.
The sky dilutes peak separation.
IV. Dan Brouthers Under the Same Sky
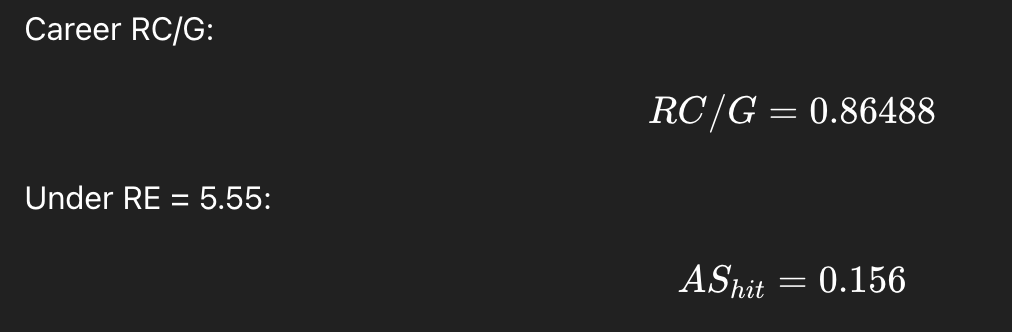
Brouthers generates roughly 15.6% of the era’s scoring atmosphere per game.
He separates more forcefully within the same inflationary climate.
That is why he stands above Hamilton in structural ranking.
V. What Extreme Skies Do to Perception
High-scoring environments create three distortions:
1. Raw totals appear cartoonish
2. Relative dominance compresses
3. Modern readers instinctively discount
But here is the key:
Even at 15.6%, Brouthers does not approach the apex band occupied by:
Babe Ruth
Ted Williams
Ty Cobb
Shoeless Joe Jackson
Josh Gibson
Those players operate around the 0.19–0.21 Atmospheric Share band.
That is a different magnitude of atmospheric penetration.
The Victorian sky compresses dominance.
The Ruthian and integrated skies allow greater relative separation.
VI. Inflation vs Separation
Extreme offensive skies do not produce greater greatness.
They often reduce visible separation.
In a 7-run environment:
It is easier to accumulate runs.
It is harder to dominate the whole atmosphere.
In a 3.7-run Deadball sky:
Fewer runs exist.
Suppression and production become proportionally larger.
This is why:
Deadball pitching can reach enormous suppression shares.
Ruthian power can carve extreme atmospheric penetration.
Integrated-era hitters can reach the .20 band.
But 19th-century hitters, even elite ones, live in the mid-.13 to mid-.15 band.
Not because they were weak.
Because the sky was thick.
VII. The Hierarchy Clarified
Under declared skies:
Hamilton: 0.138
Brouthers: 0.156
Strong.
Historically important.
But not apex.
They do not touch the .20 band.
And that is the critical clarity.
The 19th century was not inferior baseball.
It was played under an extreme offensive sky that compresses atmospheric dominance.
VIII. The Correct Modern View
Extreme skies demand proportional interpretation.
If we measure players relative to the atmosphere they inhabited:
The Victorian era produced great hitters.
It did not produce the most extreme atmospheric penetrators in baseball history.
Those come later — when run climates stabilize and separation becomes more meaningful.
This reframes the 19th century:
Not as primitive.
Not as inflated nonsense.
But as a high-density scoring climate where dominance is real — yet structurally limited.
The sky matters.
And once declared correctly, the hierarchy becomes clean.
Addendum
The Emergence of the .20 Apex Band — Why It Appears After the 19th Century
The Victorian sky compresses dominance.
The Deadball sky reveals it.
From 1880–1900, the run environment hovered around RE ≈ 5.55 , with spikes much higher. In that climate, even a historically great hitter like:
Dan Brouthers → AS ≈ .156
Billy Hamilton → AS ≈ .138
could not approach the .20 atmospheric threshold.
The sky was too thick.
The .20 band does not emerge until the run atmosphere changes.
I. What the .20 Band Represents
In the framework:
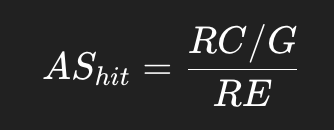
A value near .20 means:
A player generates ~20% of the entire scoring atmosphere per game.
That is not “very good.”
That is structural takeover.
It means one hitter accounts for one-fifth of all scoring oxygen in the era.
That is apex dominance.
II. Why the 19th Century Could Not Produce It
There are three structural constraints in the Victorian sky:
1. Run Saturation
When league scoring floats around 5.5–7.0 runs per game:
Total offensive output is already elevated.
Marginal separation is diluted.
Even extraordinary production spreads across a thick scoring field.
2. Offensive Distribution
Late 19th-century offenses were contact-dense and widely distributed. Power concentration had not yet emerged as a single-player distortion engine.
No one was collapsing run value into singular force.
3. Environmental Volatility
High variance seasons (1894–1897 spike) prevent stable dominance accumulation.
Extreme skies compress separation.
III. The Deadball Compression — A New Geometry
When the game shifts into the Deadball era:

The sky thins.
Runs become scarce.
In a thin atmosphere:
Each run carries more proportional weight.
Separation becomes magnified.
This is where the .20 band becomes physically reachable.
Consider:
Ty Cobb
Shoeless Joe Jackson
Operating in lower RE climates, their RC/G divided by a thinner sky expands proportionally.
Dominance intensifies.
IV. The Ruthian Revolution — Power as Compression Engine
Then comes:
- Babe Ruth
The Ruthian sky (RE ≈ 5.08) is thicker than Deadball — but Ruth collapses run production into singular force.
Power creates concentration.
Unlike 19th-century distributed contact models, Ruth’s home run dominance:
Converts multiple base states instantly
Generates isolated run value spikes
Produces RC/G numbers that overwhelm the sky
Thus the .20 band reappears — not because the sky is thin, but because the player’s force is singular.
V. The Integrated Apex — Williams and Gibson
In stabilized mid-century climates (RE ≈ 4.65):
Ted Williams
Josh Gibson
operate in moderately dense skies.
But they combine:
Elite OBP
Elite power
Concentrated run generation
This produces sustained atmospheric shares in the .19–.21 band.
The apex band is not era inflation.
It is the convergence of:
Thinner or stable skies
Concentrated offensive force
Structural consistency of competition
VI. The Apex Band Defined
The .20 band emerges when:

It requires either:
Scarcity of runs (Deadball), or
Concentration of power (Ruthian), or
Stabilized competitive equilibrium (Integrated era)
The 19th century had none of these simultaneously.
It had abundance.
Abundance diffuses dominance.
VII. The Historical Arc
The atmospheric geometry evolves:
Victorian Era
High RE → dominance compressed → apex unreachable
Deadball Era
Low RE → separation magnified → apex emerges
Ruthian Era
Moderate RE + power concentration → apex re-emerges
Integrated Era
Stabilized RE + full talent pool → apex sustained
VIII. Conclusion
The .20 Atmospheric Share band is not a statistical accident.
It is a structural threshold that becomes reachable only when:
The sky thins,
Or the player concentrates force,
Or the competitive field stabilizes.
The 19th century produced great hitters.
But it did not produce apex atmospheric penetrators.
The emergence of the .20 band marks the moment when baseball transitions from distributed run ecology to concentrated dominance geometry.
That is why:
Brouthers and Hamilton sit in the .13–.16 band,
While Ruth, Williams, Cobb, Gibson, and Jackson cross into .20 territory.
The sky changed.
And so did the physics of greatness.