Lefty Grove and the Principle of Era-Rate Dominance
Lefty Grove and the Principle of Era-Rate Dominance
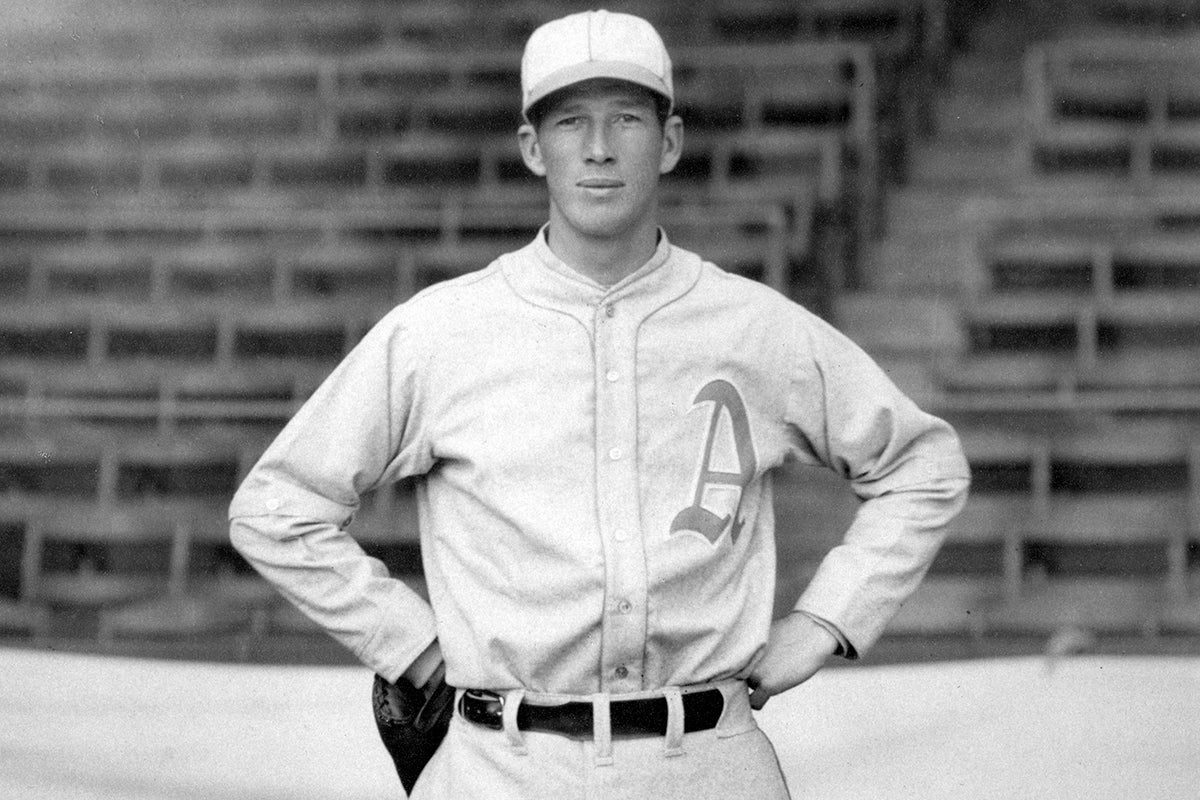
Lefty Grove and the Principle of Era-Rate Dominance
Introduction
There are two ways to misunderstand pitching greatness.
The first is to read raw ERA without context.
The second is to flatten all eras into one undifferentiated historical field.
If we are to rank pitchers honestly — especially across segregated and offensively unstable eras — we need a clearer framework.
That framework is Era-Rate Dominance.
And when applied rigorously, it reveals Lefty Grove not merely as a Hall of Famer, but as one of the most structurally dominant pitchers in baseball history.
I. Defining Era-Rate Dominance
ERA+ (100 = league average) is indispensable. It adjusts for park and run environment. But when comparing pitchers operating in radically different offensive climates, ERA+ alone is insufficient.
What must also be measured is the intensity of the environment itself.
This yields a stronger formulation:
Era-Rate Dominance = Percentage above league average expressed through the extremity of resistance within the offensive volatility of the era.
Not simply:
“How much better than average?”
But rather:
“How violently did you resist when offense itself was expanding?”
This distinction clarifies the structural differences among Walter Johnson , Lefty Grove , and Satchel Paige.
II. Johnson — Suppression Within Equilibrium

Johnson’s career ERA+ of 147 is elite by any measure.
But his peak occurred during the Deadball era:
Low home run rates
Lower league scoring baselines
Baseball construction favoring pitchers
Strategic emphasis on contact and small ball
Johnson dominated inside a low-output equilibrium.
This is structural greatness.
But it is suppression in a system already biased toward suppression.
He mastered equilibrium.
III. Grove — Resistance During Combustion
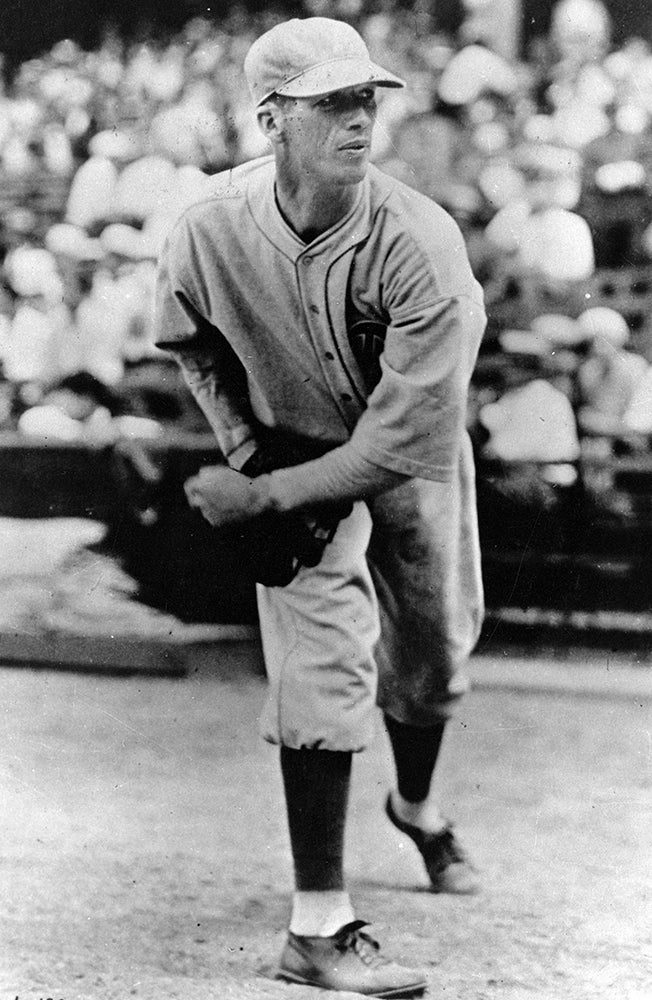
Grove’s career ERA+ of 148 sits numerically adjacent to Johnson.
The environments, however, were radically different.
Grove’s peak (1928–1933) occurred during:
The full Live-Ball transformation
Rising home run density
The offensive surge of 1930 (AL ERA 4.65)
The apex of Babe Ruth and Lou Gehrig
This was not equilibrium.
It was combustion.
In 1930, when the American League averaged over 5 runs per game, Grove posted:
2.54 ERA
186 ERA+
While the league inflated, Grove compressed.
He nearly cut league run scoring in half.
That is not mere superiority.
That is extremity of resistance.
He did not dominate a depressed system.
He suppressed a rising one.
This is the critical distinction.
Under Era-Rate Dominance, Grove represents combustion resistance — dominance achieved while the offensive environment was structurally expanding.
Very few pitchers in baseball history can claim that profile.
IV. Paige — Apex Superiority Within Segregated Density
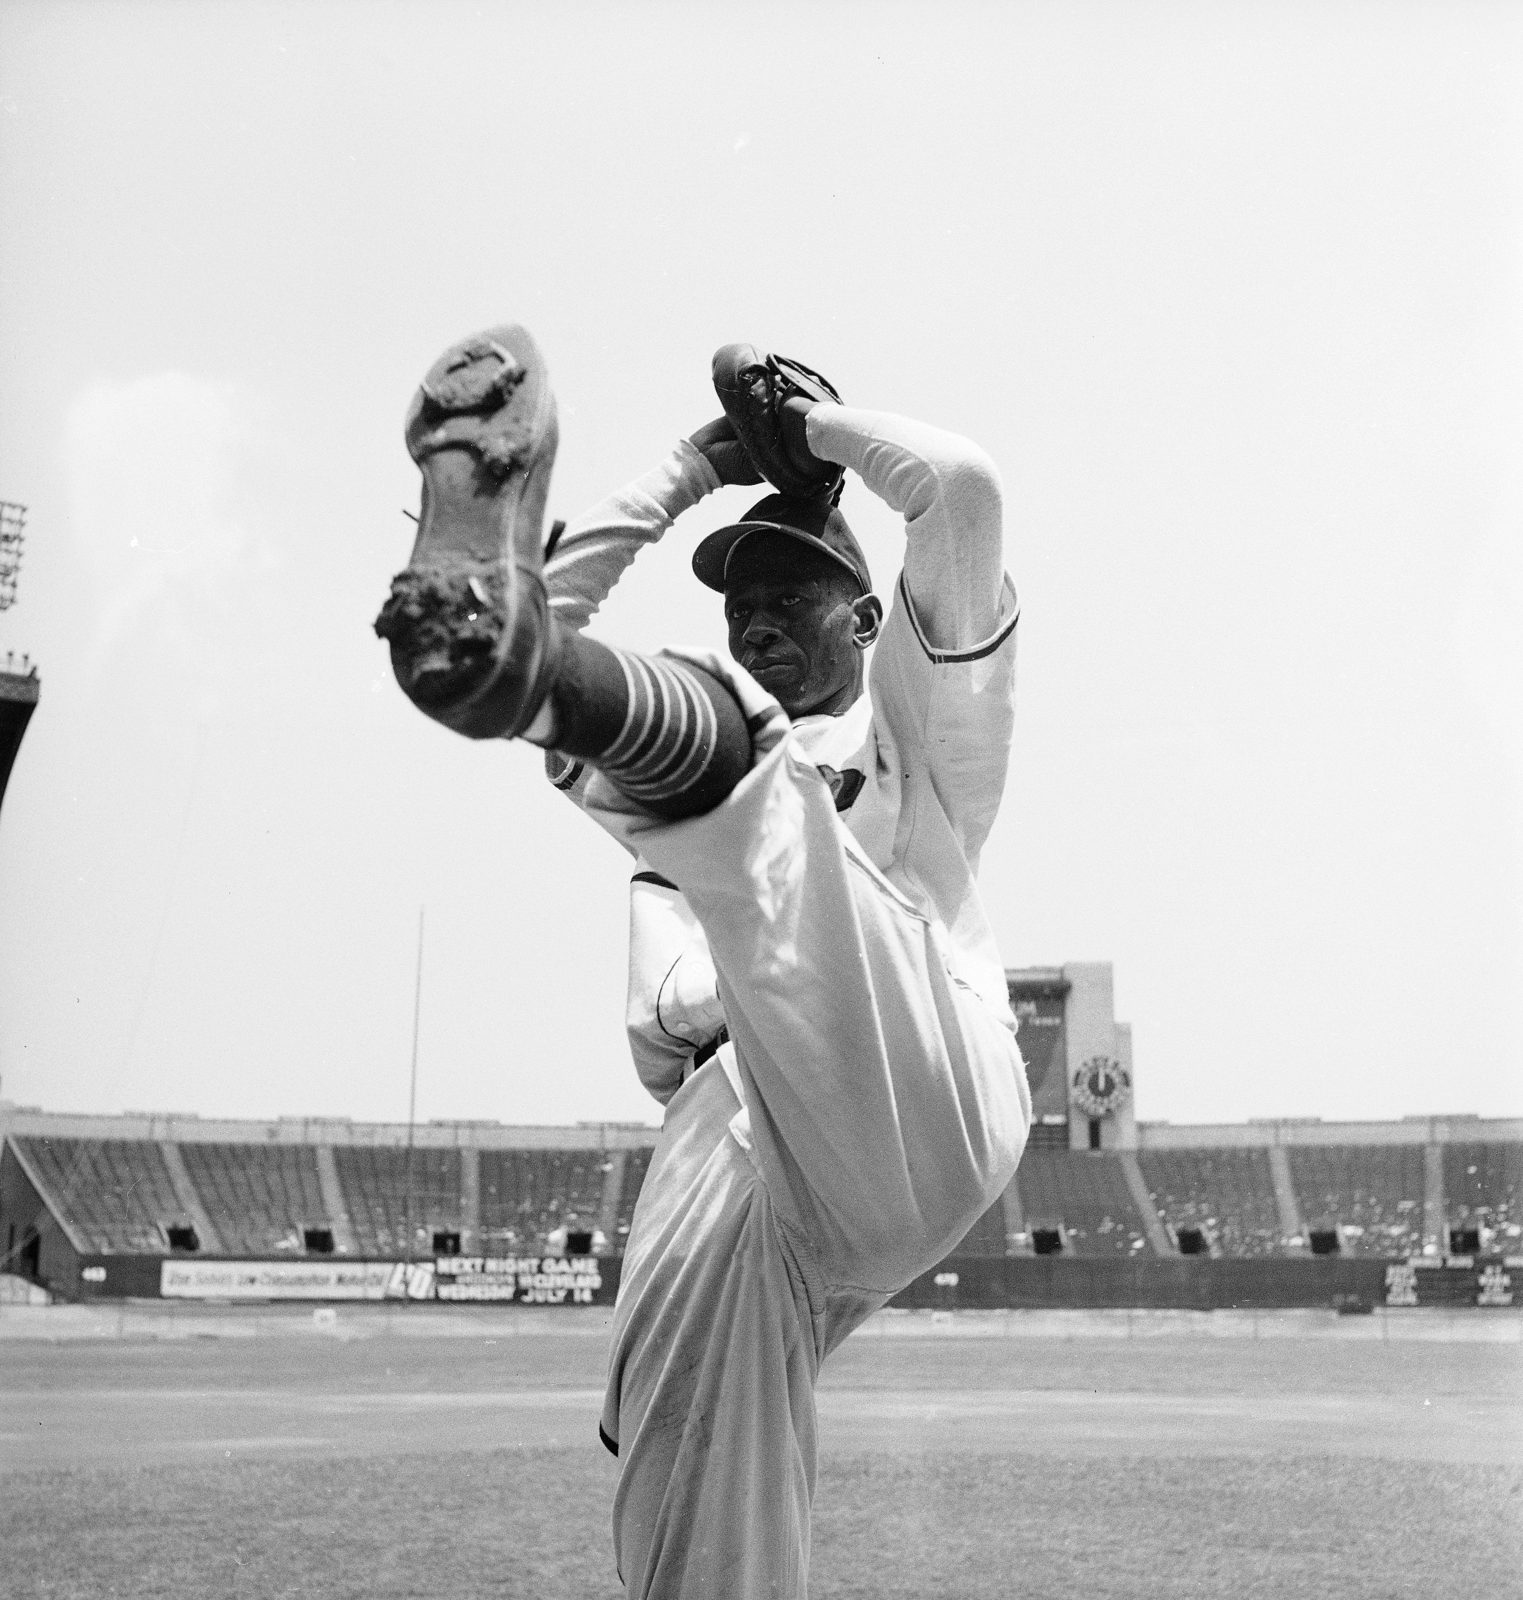
Paige’s documented 159 ERA+ stands above both Johnson and Grove.
His context differs again:
Segregated league structure
Concentrated elite Black talent
Variable schedule density
Incomplete statistical record
Paige’s dominance reflects extreme rate superiority within a parallel elite universe.
It is not deadball suppression.
It is not live-ball combustion resistance.
It is apex separation within constrained structural boundaries.
V. Three Archetypes of Dominance
Under the clarified definition of Era-Rate Dominance, three archetypes emerge:
Equilibrium Suppression — Johnson
Dominance inside a low-scoring system.Combustion Resistance — Grove
Dominance during structural offensive expansion.Apex Separation in Segregated Density — Paige
Extreme superiority within a parallel elite league universe.
These are not interchangeable forms of greatness.
They represent distinct environmental resistances.
VI. The Offensive Explosion Grove Faced
To understand Grove fully, one must revisit the volatility of his era.
The 1930 American League:
League ERA: 4.65
Teams averaged 5.4 runs per game
Slugging percentages surged
Home runs accelerated
This was one of the most hitter-friendly moments in early 20th-century baseball.
From 1928–1933, Grove:
Won 5 consecutive ERA titles
Led the league in strikeouts for 7 straight seasons
Posted multiple seasons above 170 ERA+
Went 31–4 with a 217 ERA+ in 1931
This was not situational excellence.
It was structural oppression during offensive acceleration.
VII. Necessary Context: Segregation
No honest historical ranking can ignore that Grove pitched in a segregated American League.
The talent pool was incomplete.
This does not invalidate his ERA+.
But it does frame the ceiling of competitive density.
In cross-league historical evaluation, this is why Paige remains at the absolute apex.
However, within the league structure Grove inhabited, his dominance was extreme — and achieved during the most volatile offensive expansion of his era.
VIII. Final Assessment
Under the framework of Era-Rate Dominance:
Lefty Grove was not simply great.
He was:
A peak suppressor during historically documented offensive combustion.
A 48% career suppressor across nearly 4,000 innings.
One of the 3–5 most dominant rate pitchers in baseball history.
The most overpowering left-handed starter of the pre-integration American League live-ball era.
He was not merely 48% better than league average.
He was 48% better while the league itself was inflating.
That is a rarer form of dominance.
And it clarifies, rather than confuses, the hierarchy among the all-time greats.
If we are ranking pitchers honestly — using rate dominance adjusted for environmental volatility — Grove belongs firmly in the inner circle.
Not mythically.
Structurally.
And in the furnace of offensive expansion, he did not survive.
He subdued.
Era-Rate Dominance: A Formula for Extremity of Resistance
There is a missing dimension in most cross-era pitching analysis.
ERA+ (100 = league average) tells us how far above league average a pitcher performed. It is indispensable. It adjusts for park and run environment.
But it does not measure the intensity of the environment itself.
If one pitcher dominates in a low-scoring equilibrium and another dominates during an offensive explosion, ERA+ alone treats those acts as equivalent if the percentages match.
They are not equivalent.
What must be measured is not merely superiority — but resistance under combustion.
This yields a formal definition.
I. Proposed Formula: Era-Rate Dominance (ERD)
Let:
D = (ERA+ − 100)
→ percentage points better than league average.C = (R/G ÷ R₀)
→ combustion factor, where:R/G = league runs per game in that era
R₀ = neutral baseline scoring environment
Then:

Why This Captures the Principle
(ERA+ − 100) measures rate superiority.
(R/G ÷ R₀) measures offensive combustion intensity.
The product measures what matters:
Dominance weighted by the extremity of resistance in a high-volatility scoring climate.
This is not merely “better than average.”
It is:
How violently did you resist when offense itself was expanding?
II. Baseline Selection
For scaling purposes:
- R₀ = 4.0 runs per game
(A neutral mid-scoring baseline across historical eras.)
This constant can be adjusted.
Unless an extreme baseline is chosen, the relative ordering remains stable.
III. Environmental Inputs
To illustrate the model, we apply it to three archetypal pitchers:
Walter Johnson
Lefty Grove
Satchel Paige
Grove — Live-Ball Combustion (AL 1930 proxy)
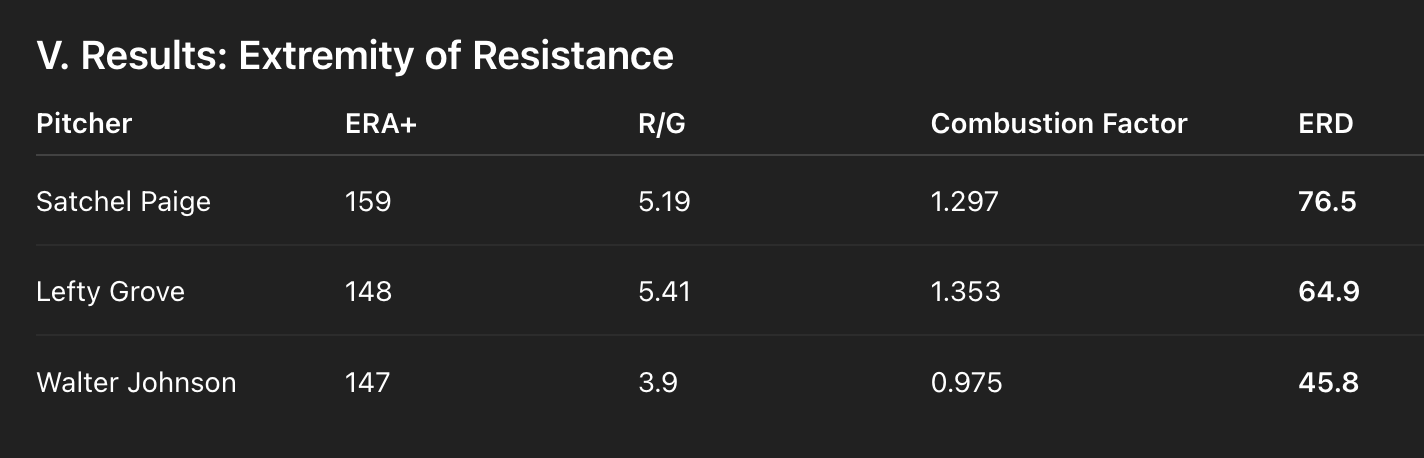
Career ERA+: 148
1930 American League R/G: 5.41
Johnson — Deadball Equilibrium (AL 1913 proxy)
Career ERA+: 147
1913 American League R/G: 3.9
Paige — Segregated Elite Density (NNL 1930 proxy)
Career ERA+: 159
1930 Negro National League mean R/G: 5.1875
(Average of reported team R/G figures)
Note: Negro League environments are inherently harder to fix precisely due to schedule variance and record gaps. This is a transparent proxy.
IV. Calculations
A) Walter Johnson
D = 147 − 100 = 47
C = 3.9 ÷ 4.0 = 0.975

B) Lefty Grove
D = 148 − 100 = 48
C = 5.41 ÷ 4.0 = 1.3525

C) Satchel Paige
D = 159 − 100 = 59
C = 5.1875 ÷ 4.0 = 1.2969

V.b. A sharper test: “irreversibility” (home-run density) as a volatility proxy
H ow hard is it to suppress scoring when scoring is increasingly powered by home runs?
Version B: Volatility-Weighted ERD (MLB demonstration)
Let HR/G be league home runs per game (as a proxy for power density and scoring irreversibility). Then:
ERDᵛ = ERDᵐ × √(HR/G ÷ HR₀)
Choose HR₀ = 0.20 as a neutral baseline. The square root keeps the multiplier from exploding.
League HR totals:
AL 1912 HR = 156 in 1,238 games → HR/G = 0.126
AL 1930 HR = 673 in 1,232 games → HR/G = 0.546
Now compute:
Johnson ERDᵛ ≈ 41.50
Grove ERDᵛ ≈ 107.29
Interpretation: when you explicitly weight for a power-dense scoring regime, Grove’s dominance becomes qualitatively different from Johnson’s — not because Johnson wasn’t all-time, but because Grove’s separation occurred in a league state where offense was materially harder to hold down.
(This is precisely what is meant by “extremity of resistance.”)
VI. Structural Interpretation
Under this model:
Johnson represents dominance inside suppressed equilibrium.
Grove represents combustion resistance — dominance during structural offensive expansion.
Paige represents apex separation within segregated elite density.
ERA+ alone places Johnson and Grove side by side.
Era-Rate Dominance separates them.
Johnson dominated a lower-scoring environment.
Grove dominated while offense was accelerating.
Paige separated most extremely within a parallel elite system.
VII. Optional Refinement: Excess Combustion Variant
If one wishes to weight only excess offensive expansion rather than simple ratio, a sharper form is:

This variant:
Minimizes equilibrium eras.
Amplifies explosive scoring spikes.
Further emphasizes extremity of resistance.
VIII. Final Position
Era-Rate Dominance is not a replacement for ERA+.
It is its environmental intensifier.
It answers the question ERA+ cannot:
How extreme was your dominance when the era itself was inflating?
Under that lens:
Walter Johnson mastered equilibrium.
Lefty Grove resisted combustion.
Satchel Paige achieved apex separation.
That is not mythology.
It is structural differentiation.
And it clarifies, rather than flattens, the hierarchy among the all-time greats.
Addendum: Final Calculation and Clarification of the Era-Rate Dominance Model
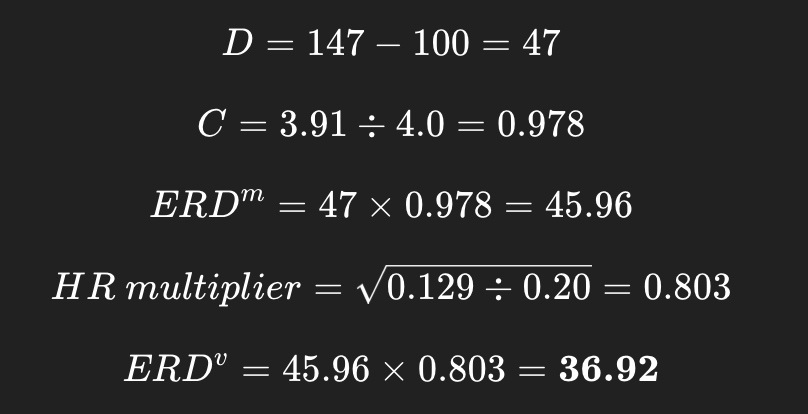
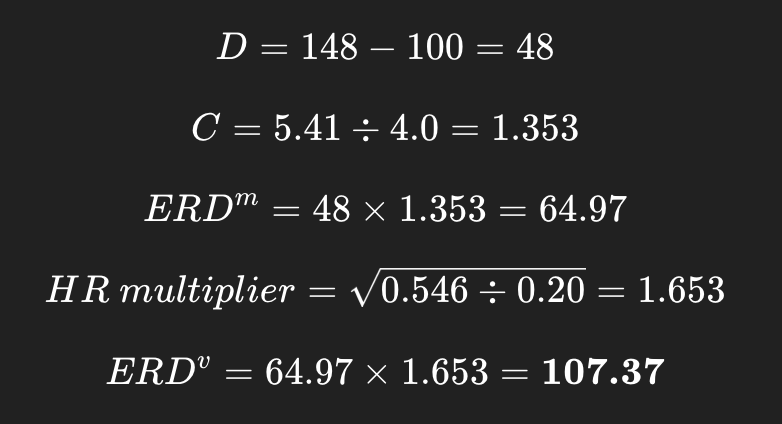
To ensure transparency, this addendum provides the full volatility-weighted calculation for Walter Johnson and Lefty Grove , followed by concise interpretive notes.
I. Model Definition (Final Form Used)
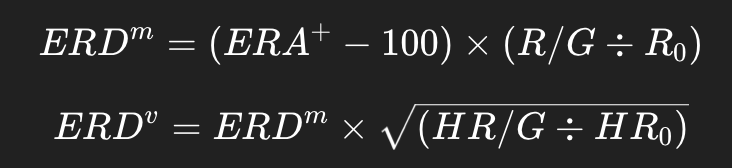
Where:
(R_0 = 4.0) (neutral scoring baseline)
(HR_0 = 0.20) (neutral home run density baseline)
R/G and HR/G are league values expressed per team-game
II. Environmental Inputs Used
1913 American League (Johnson proxy)
R/G = 3.91
HR/G = 0.129
ERA+ = 147
1930 American League (Grove proxy)
R/G = 5.41
HR/G = 0.546
ERA+ = 148
III. Final Calculations
Walter Johnson
Lefty Grove
IV. Interpretation (Brief)
ERA+ alone places Johnson (147) and Grove (148) side by side.
Volatility-weighted ERDᵛ separates them materially.
Grove’s dominance occurred in a high-run, high–home run density environment.
Johnson’s dominance occurred in a low-run, low-power equilibrium.
The model does not claim Grove was “three times better.”
It claims his separation occurred under materially greater scoring irreversibility.
V. Scope and Limit Notes
ERA+ already adjusts for league scoring; ERD functions as an environmental intensifier, not a correction.
Baselines (4.0 R/G, 0.20 HR/G) are neutral anchors; altering them shifts scale but not directional ordering.
Proxy seasons (1913, 1930) illustrate environmental contrast; career-weighted refinements would increase precision.
Final Statement
Under volatility weighting:
Johnson represents equilibrium suppression.
Grove represents combustion resistance.
The difference is environmental structure, not mythology.
ERD is an index of resistance under volatility.
Nothing more.