Men Against the Avalanche: Phase Changes, the Rabbit Ball, and the Pitchers Who Defied the Physics of Baseball
Men Against the Avalanche: Phase Changes, the Rabbit Ball, and the Pitchers Who Defied the Physics of Baseball
Men Against the Avalanche: Phase Changes, the Rabbit Ball, and the Pitchers Who Defied the Physics of Baseball
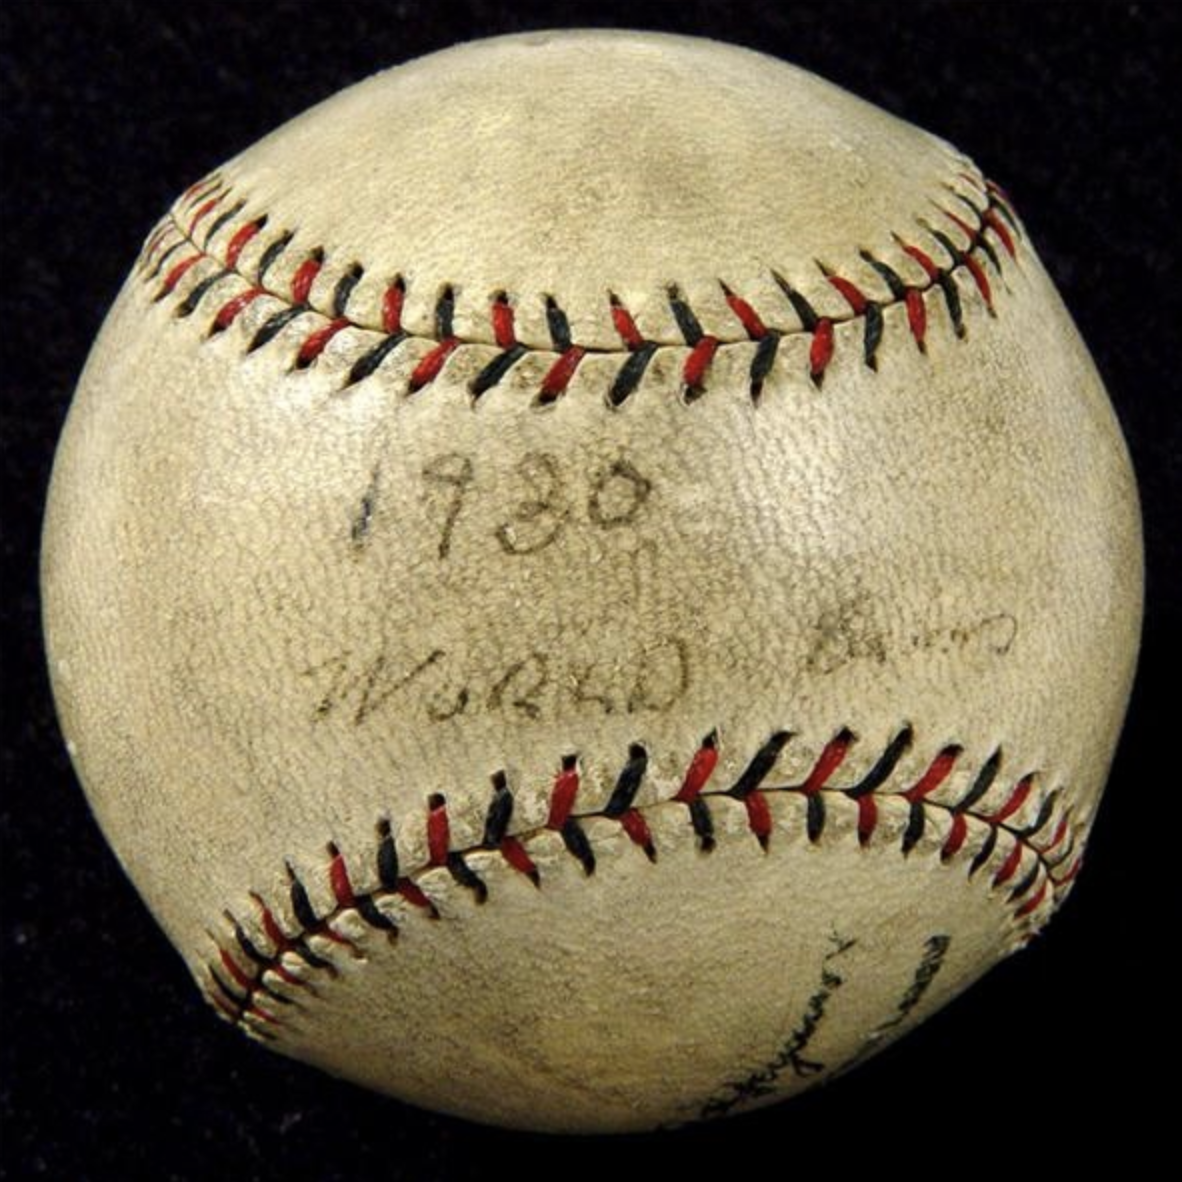
Prologue: The Ball Is the Control Variable
Baseball is a phase-change system. Like water moving between ice, liquid, and steam, the competitive equilibrium of the sport shifts between stable states—and nearly every major transition in baseball history has been triggered not by the players, not by the managers, not by the strategies, but by changes to the baseball itself, to the distance from which it is delivered, or to the rules governing what a pitcher may do to it before he throws it.
The ball is the control variable. Everything else—hitting styles, pitching strategies, the run economy, the balance of power between offense and defense, the very identity of the sport—is a dependent variable that reorganizes around whatever the ball is doing. Change the ball, and you change the game. Not gradually, the way a player improves over a career. Suddenly, the way a liquid becomes a gas when the temperature crosses a threshold.
Baseball has undergone at least five major phase changes since its professionalization, and in every case, the transition follows the same pattern: the physics of the ball shifts, the run ecosystem inflates or deflates accordingly, the sport’s entire strategic architecture reorganizes around the new equilibrium, and the men who cannot adapt are swept away. What follows is the story of those transitions—and of the vanishingly small number of pitchers who, in the most extreme offensive environments the sport has ever produced, refused to be swept away with the rest.
Part I: The Phase Changes — A Fifty-Year Weather System
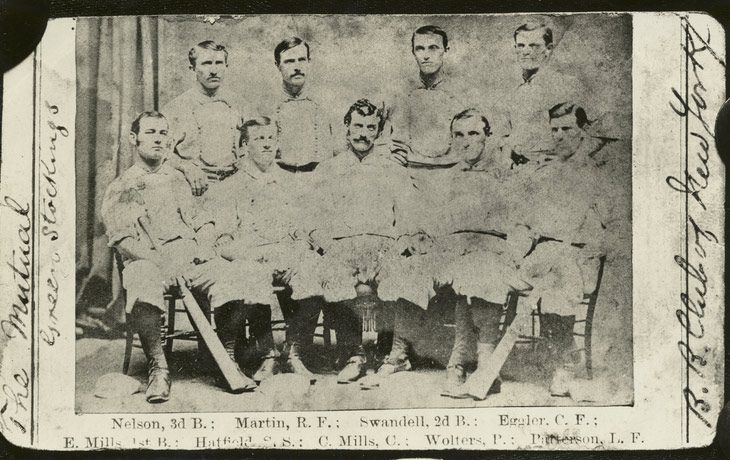
Phase 1: The Disruption at Origin (1870s–1890s)
Baseball in its earliest professional decades was a sport still searching for its physics. The relationship between pitcher and hitter was being negotiated in real time, with the rules changing almost annually. The pitching distance started at 45 feet. Pitchers initially delivered the ball underhand, then sidearm (permitted in 1883), then overhand (1884). The number of balls required for a walk fluctuated between nine and four across different seasons. Foul balls were not counted as strikes until 1901 in the National League and 1903 in the American League. The pitcher’s “box”—a rectangular area from which the pitcher could roam freely, even taking a running start—was a fundamentally different launching platform than the fixed rubber slab of the modern game.
In this chaotic environment, scoring oscillated wildly. In the 1860s, games routinely featured 35 or more combined runs, aided by a ball so lively that it would reportedly bounce nearly to the top of a two-story building if dropped from the roof. Then came the “dead ball” of the late 1860s—a deliberate construction change—and scoring plummeted. Then pitchers got too dominant, and the rules were adjusted again. It was a feedback loop with no stable resting point: offense surged, pitching adapted, rules intervened, offense surged again.
The single most dramatic disruption came in 1893, when the National League eliminated the pitcher’s box and moved the pitching rubber back to 60 feet, 6 inches from home plate. The actual increase in distance was only about five feet (the old box had been 5.5 feet deep, and pitchers threw from the back of it), but the effect was seismic. The five-foot increase was equivalent to roughly a 10 percent reduction in the effective velocity of every fastball in the league—a pitcher who had been throwing the equivalent of 90 mph now arrived at the plate at the effective speed of 81. The league ERA jumped from 3.28 in 1892 to 4.66 in 1893 to 5.33 in 1894. The NL batted .309 in 1894—the highest league average in history—with five players hitting over .400, four of them in the Philadelphia outfield alone.
This was the first great phase change of modern baseball: a sudden, violent shift in the competitive equilibrium, triggered entirely by a change in the physical parameters of the pitcher-hitter interaction. It would not be the last.
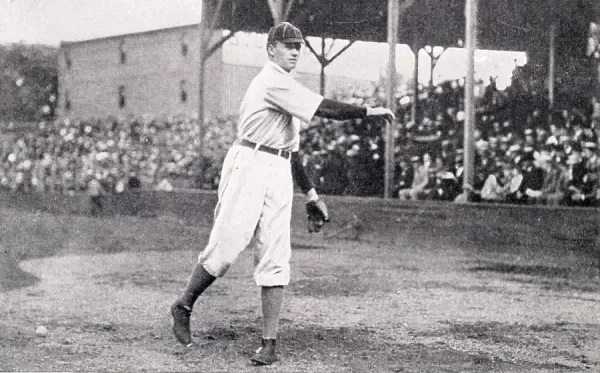
Phase 2: The Deadball Settlement (1900–1919)
The 1894 explosion did not last. Within a few years, the system found a new equilibrium—but it settled on the pitcher’s side. Bigger, harder-throwing pitchers who could handle the new distance replaced the smaller, finesse pitchers who had thrived at 50 feet. The foul-strike rule was adopted (1901 NL, 1903 AL), immediately increasing strikeout rates by more than 50 percent. Fielding improved. And the ball itself—kept in play for entire games until it was soft, scuffed, tobacco-stained, and nearly invisible—became an instrument of pitcher dominance.
The Deadball Era was not, as its name implies, a period of dead baseball. The ball was the same object that had produced the 1894 explosion. What had changed was everything around it: the rules (foul-strike), the delivery (unrestricted overhand pitching from a fixed rubber at 60 feet 6 inches), and critically, the condition of the ball in play. A baseball used for 100 pitches becomes soft. A soft ball absorbs energy on contact rather than returning it. A dark, scuffed ball is nearly impossible to see against the backdrop of a crowd. And a ball that a pitcher has legally doctored with spit, tobacco juice, mud, or emery paper moves in ways that a clean ball cannot.
The result was the most pitcher-dominant phase in baseball history. In 1908, the major league batting average fell to .239 and teams averaged just 3.4 runs per game—the lowest ever. Ed Walsh posted a career ERA of 1.82. Addie Joss finished at 1.89. Christy Mathewson and Walter Johnson dominated for over a decade. The home run barely existed: on thirteen occasions between 1900 and 1920, the league leader in home runs had fewer than ten. The game’s offensive strategy revolved entirely around “small ball”—bunting, base-stealing, the hit-and-run, manufacturing one run at a time—because the physics of the ball made power hitting essentially impossible.
This was a stable equilibrium. The system had settled. Pitchers had the ball, the rules, and the conditions on their side. The run economy was deeply deflationary. And it would have stayed that way indefinitely if the control variable hadn’t changed again.
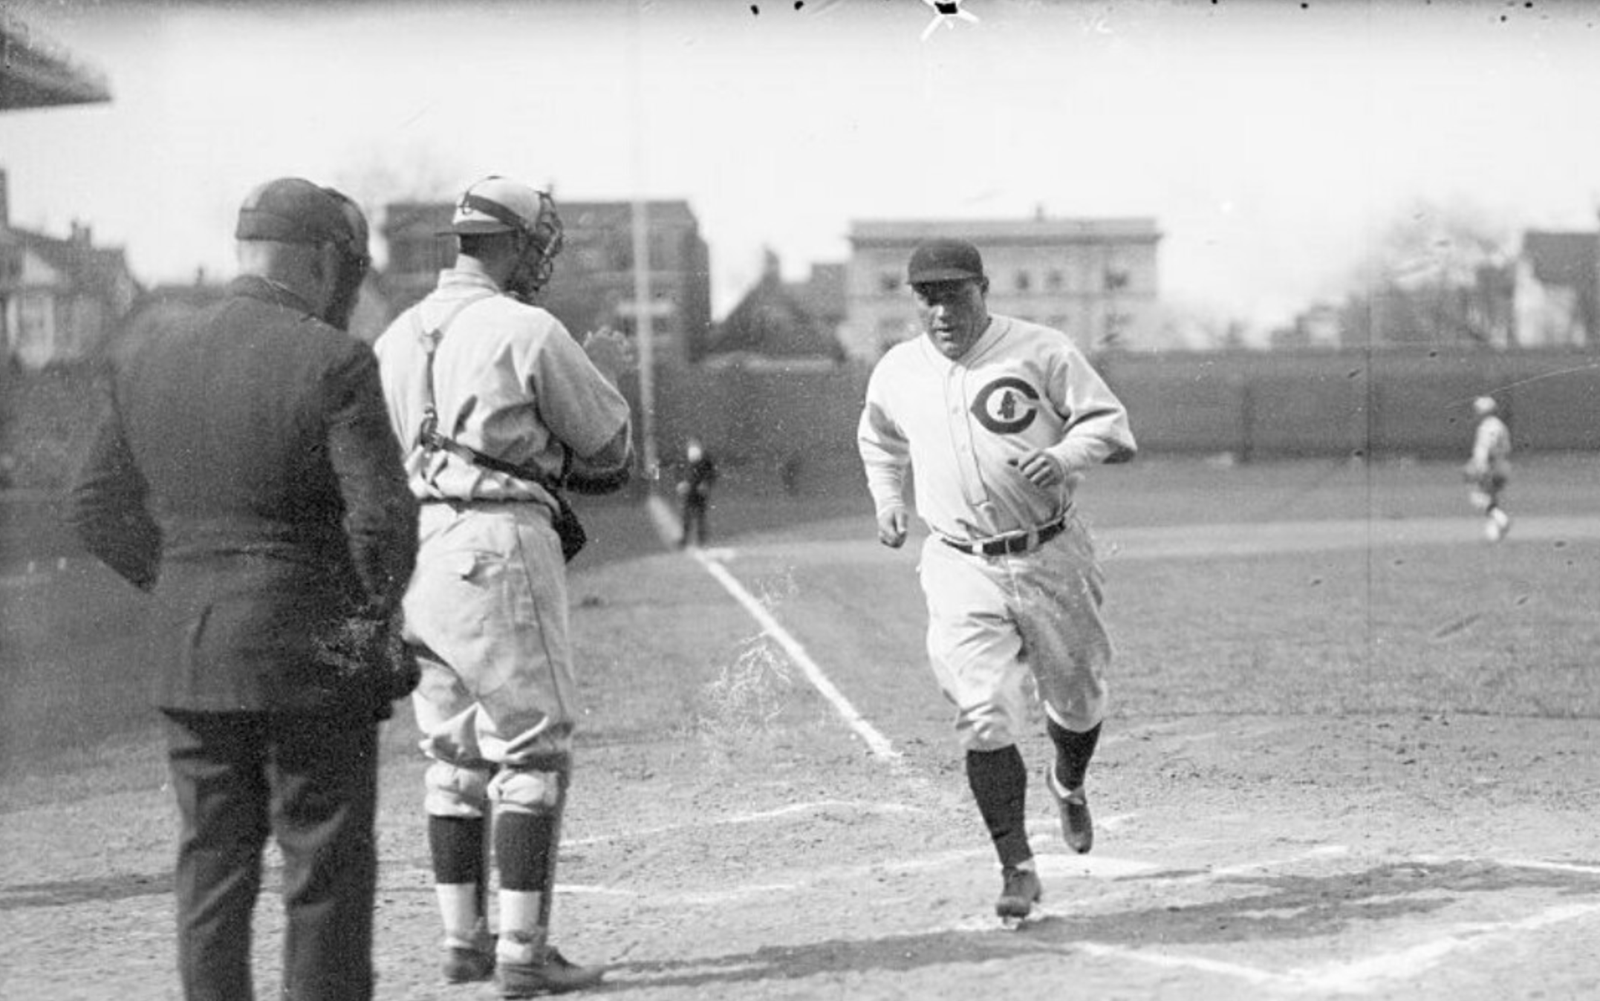
Phase 3: The Live-Ball Explosion (1920–1930)
Between 1919 and 1921, everything changed—and the speed of the change is the clearest evidence that it was driven by physics, not player development.
The trigger was a cascade of simultaneous alterations to the ball and the rules governing it. In 1920, the spitball and all other doctored pitches were banned (with 17 pitchers grandfathered in). Umpires were instructed to replace dirty or scuffed baseballs far more frequently, ensuring that hitters now faced a clean, bright, resilient target rather than a dark, soft, unpredictable one. And beginning in 1919, the baseball itself was wound with a higher grade of Australian wool yarn, with cores wound by machine rather than hand, producing a ball that was springier and flew farther off the bat. Manufacturers denied that the ball was different. Pitchers were certain it was.
The Ray Chapman tragedy of August 1920—the only on-field death in major league history, caused by a pitch the batter likely couldn’t see because the ball was so discolored—accelerated the rule requiring fresh baseballs. The unintended consequence was that hitters now faced a ball they could see clearly, that was hard rather than soft, and that retained energy on contact rather than absorbing it.
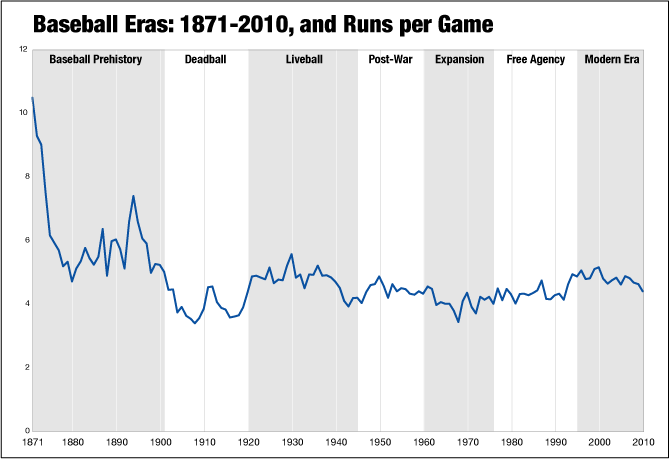
The result was instantaneous. By 1921, offenses were scoring 40 percent more runs and hitting four times as many home runs as they had in 1918. This was not a gradual shift. It was a phase change—a step function, not a slope. The system jumped from one stable state to another in the space of two seasons.
And then there was Babe Ruth. Ruth’s role in the phase change is often overstated as a cause and understated as an accelerant. The conditions that enabled the home-run revolution—the clean ball, the banned spitball, the livelier construction—were in place before Ruth fully emerged as a power hitter. His AL-leading home run totals exploded from 11 in 1918 to 29 in 1919 to 54 in 1920, a near five-fold increase in two seasons that directly paralleled the changes in the ball. Ruth didn’t create the live-ball era. The live-ball era created the conditions for Ruth. But Ruth then demonstrated, conclusively and spectacularly, that the home run was not just possible under the new physics but strategically optimal. An entire generation of hitters followed his example.
The offensive escalation that began in 1920 didn’t peak immediately. It built across the decade as hitters internalized the new physics and optimized their approaches to exploit them. Batting averages climbed. Home runs multiplied. Runs per game rose steadily. And the ball kept getting livelier—the seams got lower, the hide got thinner, the winding got tighter—until the system reached its absolute peak.
Phase 4: The 1930 Singularity
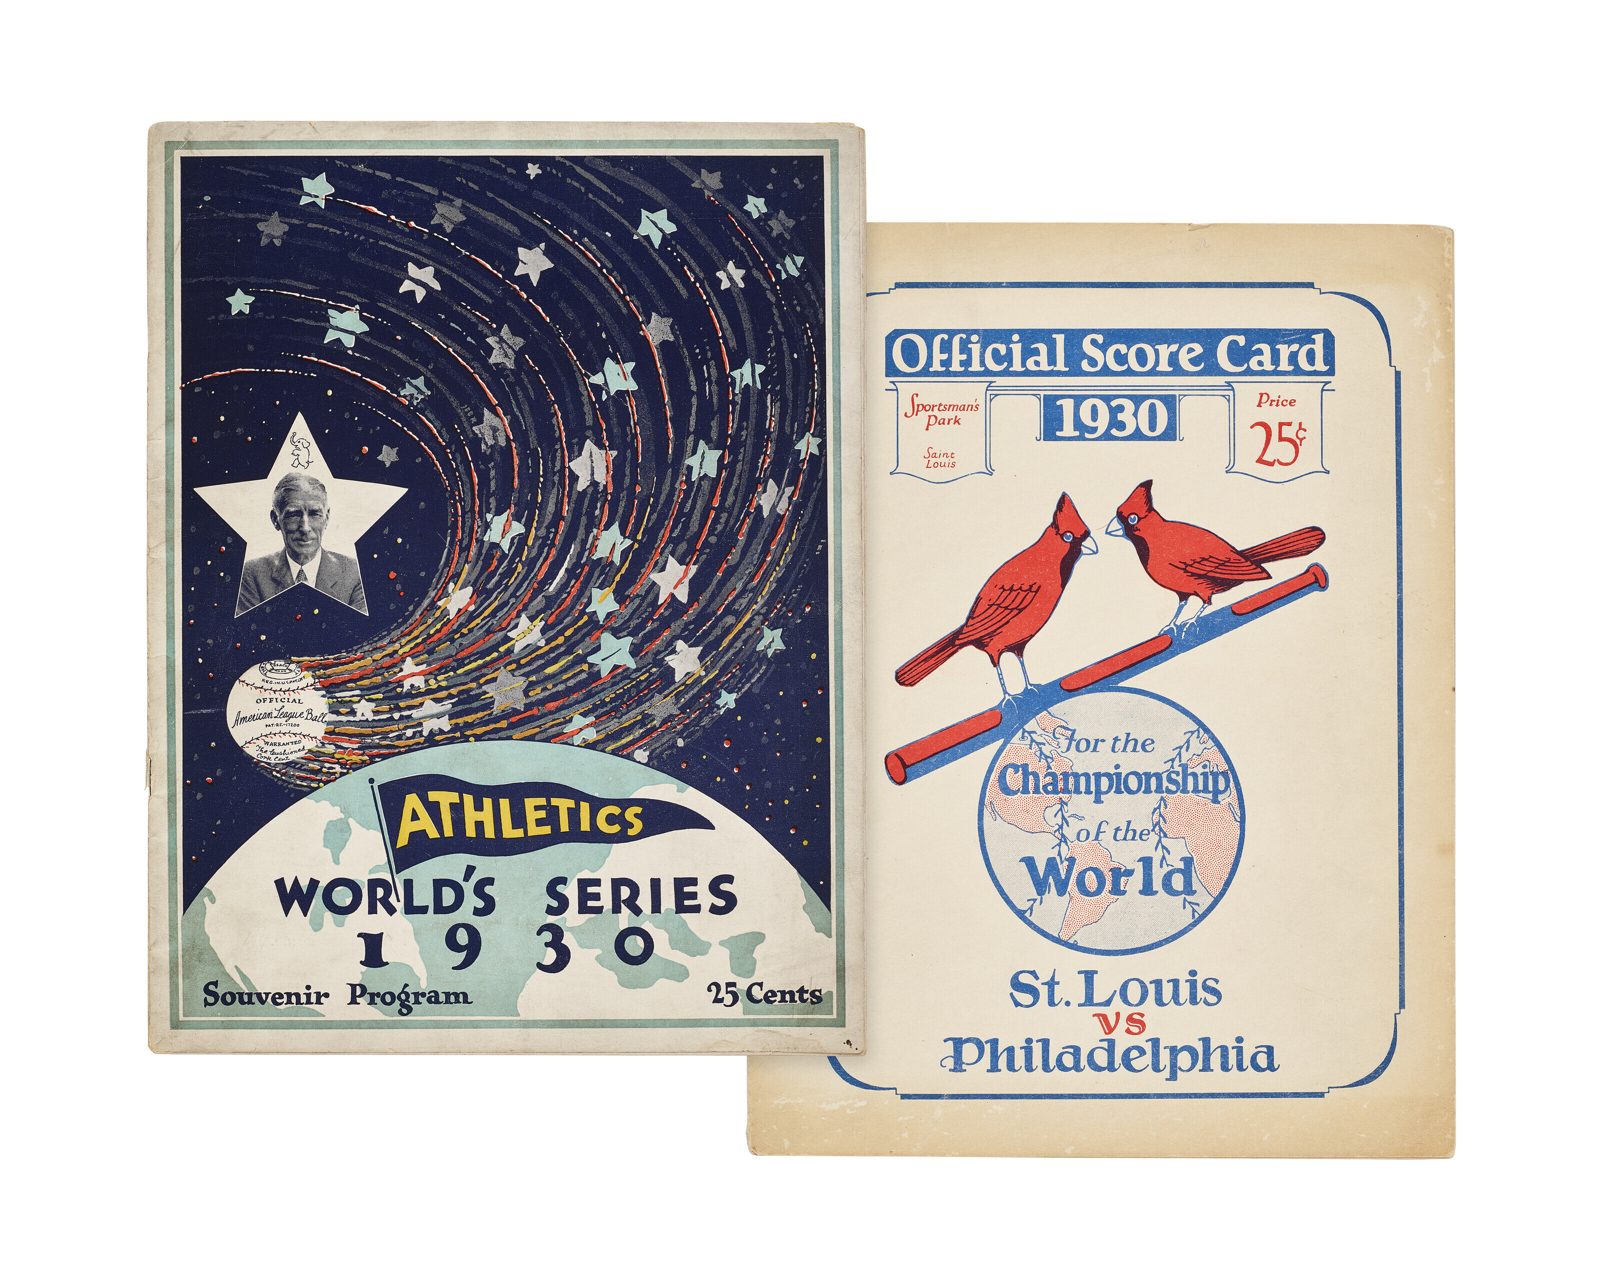
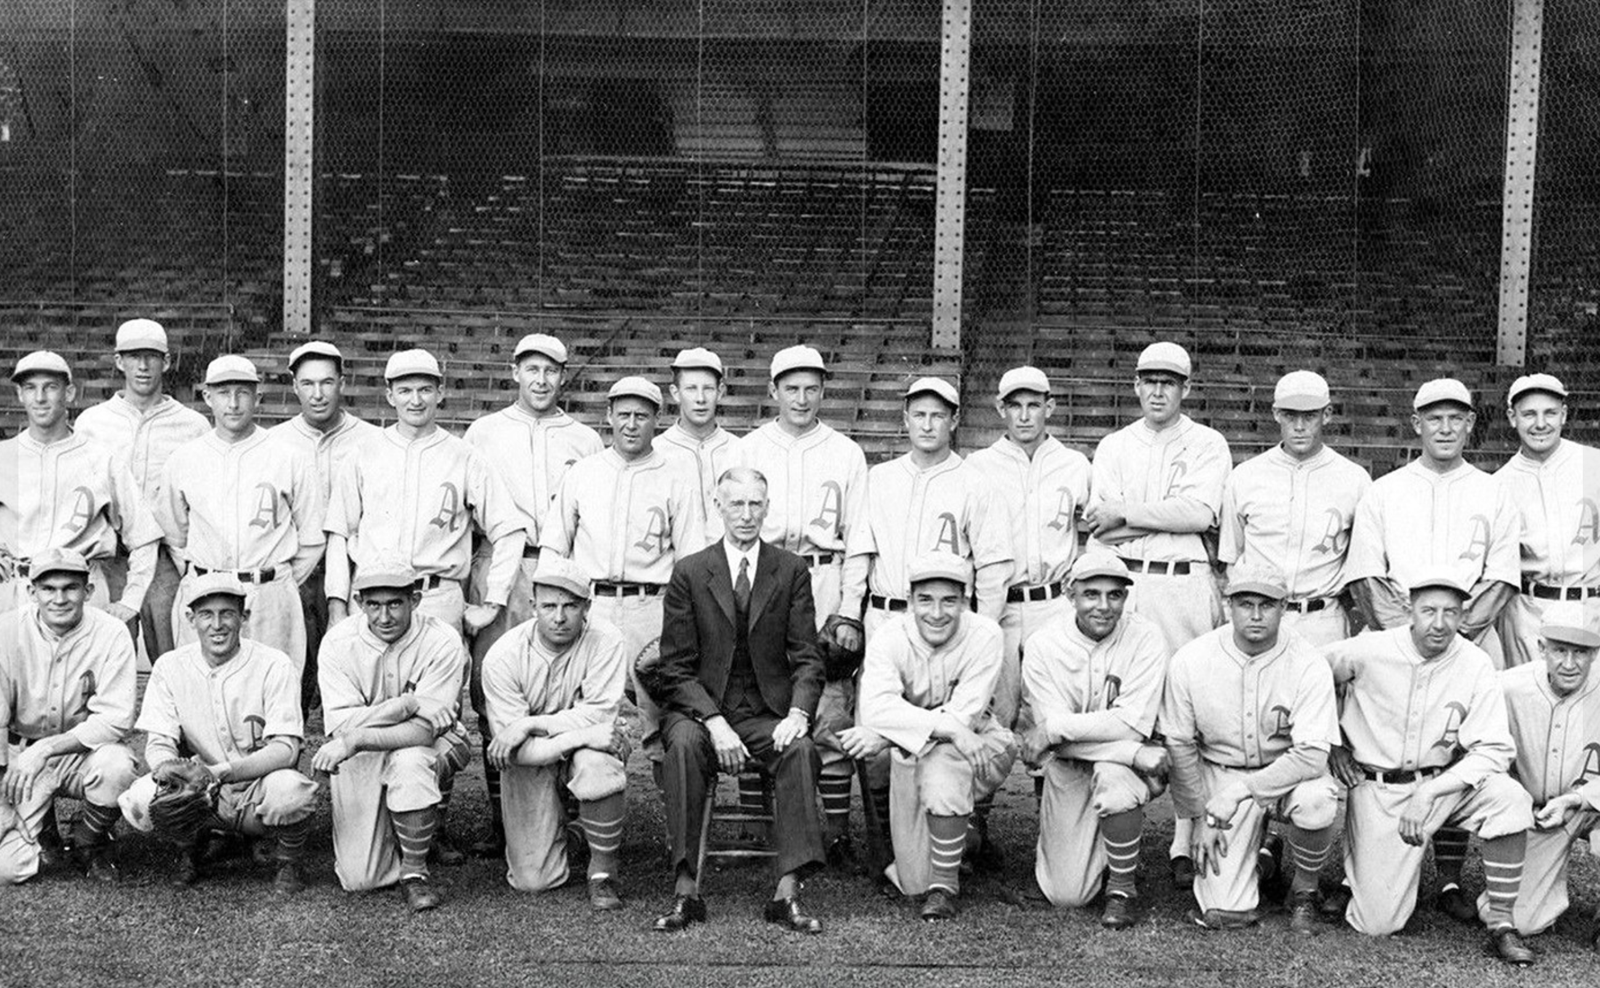
The 1930 season was not just a high-water mark. It was a singularity—the point at which the escalating live-ball trend reached a state so extreme that the system could no longer sustain itself and had to be corrected by deliberate intervention.
The numbers are almost hallucinatory. The National League batted .303 as a whole, with six of eight teams above .300. The New York Giants batted .319—the highest team average of the twentieth century. Nine of sixteen major league teams cleared .300. The majors averaged 5.55 runs per game. Home runs surged 16 percent over the previous year, reaching 1,565. The Yankees became the first team to score over 1,000 runs.
Bill Terry hit .401—the last National Leaguer to reach that plateau. Hack Wilson slugged 56 home runs and drove in 191—a single-season RBI record that still stands. Seven qualified hitters batted .379 or better. The pennant-winning Cardinals batted .314, scored a modern NL record 1,004 runs, and had all eight regular starters above .300. The Phillies batted .315 as a team and finished last because their pitching was so thoroughly obliterated that they lost games 18–5, 17–4, 15–7, and 19–16. They once scored 30 runs in two consecutive games and lost both.
Guy Bush of the Cubs surrendered a National League record 155 runs on 291 hits in 225 innings. Opponents batted .316 against him. His ERA was 6.20. His record: 15–10. Ray Kremer of the Pirates won 20 games with an ERA above 5.00. The NL’s league ERA was 4.97. In the entire National League, exactly one man posted an ERA below 2.70: Dazzy Vance, at 2.61. The gap between Vance and the second-best ERA (Carl Hubbell’s 3.87) was 1.26 runs—the largest margin in major league history.
John McGraw, the Giants’ manager, complained bitterly that the lively ball had eliminated bunting and base-running from the game. Cubs president William Veeck argued the opposite—that fans wanted slugfests, not pitching duels. Both were right. The small-ball strategies that had defined baseball for two decades were now obsolete because the physics of the ball had made them irrelevant. Why sacrifice a runner to second when the next hitter might deposit the ball over the fence? The entire strategic architecture of the game had reorganized around the new equilibrium—an equilibrium that had tilted so far toward offense that pitching had become nearly impossible.
This was the crisis point. The system corrected itself—but only because the league intervened. After the 1930 season, the NL instructed the Spalding Company to add a slightly thicker cover and raise the seams. NL President John Heydler described it as adding “about a paper-thickness of leather” and binding the ball with four strands of thread instead of three. The results: the NL’s batting average fell from .303 to .277, and home runs were cut nearly in half, from 892 to 493, in a single year. The American League did not make the change. Its scoring stayed elevated for the rest of the decade. The two leagues used different baseballs until 1940—the most dramatic inter-league divergence in baseball history, caused entirely by a paper-thickness of cowhide.
The 1930 correction proved what the entire fifty-year sequence had been demonstrating: the ball is the control variable. Change it by a paper-thickness and you change everything. The hitting styles, the pitching strategies, the run economy, the strategic identity of the sport—all of it reorganizes around whatever the ball is doing. Baseball’s first half-century was a weather system of phase changes, and the barometric pressure was set by the baseball.
Part II: The Physics — Why the Rabbit Ball Is a Force Problem
Rate of Force Conversion
A baseball is a system of physics. It has a coefficient of restitution—a measurement of how much energy it retains when it collides with a bat. A dead ball absorbs impact and comes off the bat slowly. A live ball retains energy and launches faster and farther. The material differences can be remarkably small—a slightly thinner hide, a tighter yarn winding, a fractionally different seam height—and the competitive consequences enormous.
Here is the critical point: when you change the ball, you change the rate of force conversion between pitcher and hitter. A pitcher can throw the exact same pitch—same velocity, same spin, same location, same movement—and the outcome is different. A ground ball becomes a line drive. A warning-track fly becomes a home run. The pitcher has done nothing wrong. His mechanics haven’t changed. His stuff hasn’t declined. The physics of the collision have been altered at the molecular level of the ball’s construction, and there is nothing he can do about it.
This is what makes the rabbit ball categorically different from every other offensive advantage. A shrinking strike zone is something a pitcher can adjust to. Expansion-diluted pitching is an organizational problem. Even steroids, while they increase bat speed and strength, still require the hitter to make contact with a moving, breaking pitch. But the rabbit ball undermines the pitcher’s craft at the point of contact itself. It doesn’t matter how sharp the curveball breaks if the ball’s construction turns a topped grounder into a scorched single. The pitcher has no recourse. He can’t un-juice the ball. He can only absorb the damage.
The Asymmetry
The rabbit ball is a one-sided subsidy. A hitter benefits passively, automatically, on every ball he puts in play. Every ground ball is a little harder. Every fly ball carries a little farther. The rising tide lifts all boats. A below-average hitter becomes average. An average hitter becomes good.
A pitcher receives no corresponding benefit. His fastball does not get faster. His curveball does not break more. To merely maintain his previous statistical performance, he must actually get better—miss more bats, generate more swings and misses, induce weaker contact. To stand out as dominant, he must be so far above the field that the altered physics cannot close the gap.
Part III: The Economics — Inflation in the Run Ecosystem
A baseball game is an economy. Runs are the currency. Pitchers suppress the currency; hitters produce it. When the ball is juiced, what happens is not simply that hitters improve. What happens is inflation. The entire run ecosystem inflates.
More runs scored across the league means the threshold for “good” pitching performance rises. An ERA of 3.50 that was excellent in a normal year becomes merely average when the league ERA is 5.00. A pitcher who gives up four runs in seven innings has done his job under normal conditions; in a rabbit-ball environment, he has given his team a coin-flip chance at best, because the opposing lineup is scoring five or six runs with ease.
This cascading effect is the baseball equivalent of printing money. The currency is devalued, and every pitcher’s statistical line inflates—not because he is pitching worse, but because the physics have changed the exchange rate between effort and result. Over a full season, phantom runs accumulate: home runs that would have been fly outs, doubles that would have been singles, runs that exist only because of the ball’s construction. A pitcher’s ERA no longer reflects his skill. It reflects the distortion.
The deeper damage is strategic. When the run economy inflates, the entire architecture of the game reorganizes. Pitching staffs that were adequate become inadequate. Teams that relied on run prevention are forced to slug their way to wins. Small ball—bunting, stealing, the hit-and-run—disappears because it can’t keep pace with the inflated currency. The game collapses into a home-run derby by default. This happened in 1930. It happened again in 2000. In both cases, John McGraw’s complaint applied: the ball had eliminated everything but the long ball.
Part IV: The Second Cycle — 2000 and the Steroid-Ball Compound
The Recurrence
Seventy years after 1930, baseball entered another rabbit-ball phase—but this time, the juiced ball was compounded by juiced bodies.
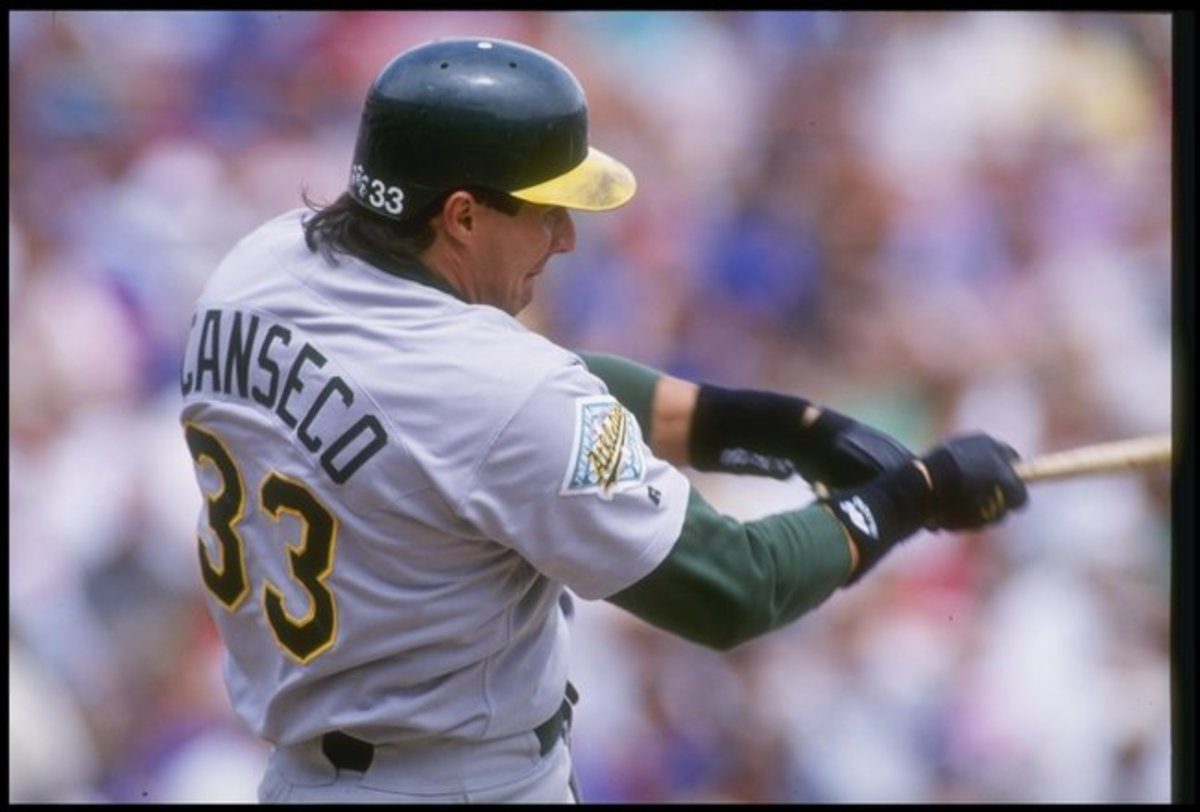
The steroid era, generally placed between the late 1980s and late 2000s, reached its peak around 2000. MLB had banned steroids in 1991 but did not test until 2003. Jose Canseco estimated 80 percent of players used PEDs. Ken Caminiti admitted winning the 1996 MVP while juicing. McGwire hit 70. Sosa hit 66. Bonds hit 73. Between 1998 and 2009, ten players reached the 500-homer club; six have been linked to PEDs.
But steroids alone do not explain the offensive surge—and the evidence for the ball is, once again, the suddenness of the spike. Home runs per game jumped from 0.7 in 1992 to 1.2 by 2000. The sharpest year-over-year increases came in 1993 and 1994, before peak steroid adoption. Multiple independent studies have found construction differences in the baseballs. Analyst Eric Walker has argued that the step-function quality of the spike—sudden, not gradual—points to the ball, not the players. The seasons with the largest single-year jumps in home run rate in baseball history are: 1977 (MLB changed ball manufacturers from Spalding to Rawlings), 1969 (mound lowered, strike zone shrunk), 2016 (first full season with confirmed reduced-drag ball), and 1993. None correspond to known inflection points in steroid adoption. All correspond to known or suspected changes in the baseball.
Further compounding the environment: expansion in 1993 and 1998 diluted pitching talent. New ballparks (Coors Field) created hitter-friendly environments. The strike zone shrank throughout the 1990s. By 2000, the AL ERA was approximately 5.00. Forty-seven players hit at least 30 home runs. Fifty-three qualified batters hit .300. The run ecosystem was as inflated as 1930—possibly more, because the inflation was driven not just by the ball but by chemically enhanced bat speed swinging at it.
The pattern was identical to 1930: a live ball, institutional denial, inflated records, and a correction that came too late to prevent the damage.
Part V: The Impossibly Small List — The Men Who Beat the Physics
Across both eras, the list of pitchers who achieved genuine dominance during the most extreme offensive environments is preposterously small. In 1930, across sixteen teams and hundreds of pitchers, exactly two posted ERAs below 3.00: Lefty Grove (2.54) and Dazzy Vance (2.61). In 2000, across thirty teams, exactly one American League pitcher posted an ERA below 2.50: Pedro Martinez (1.74).
Three men. Two eras. That is the list.
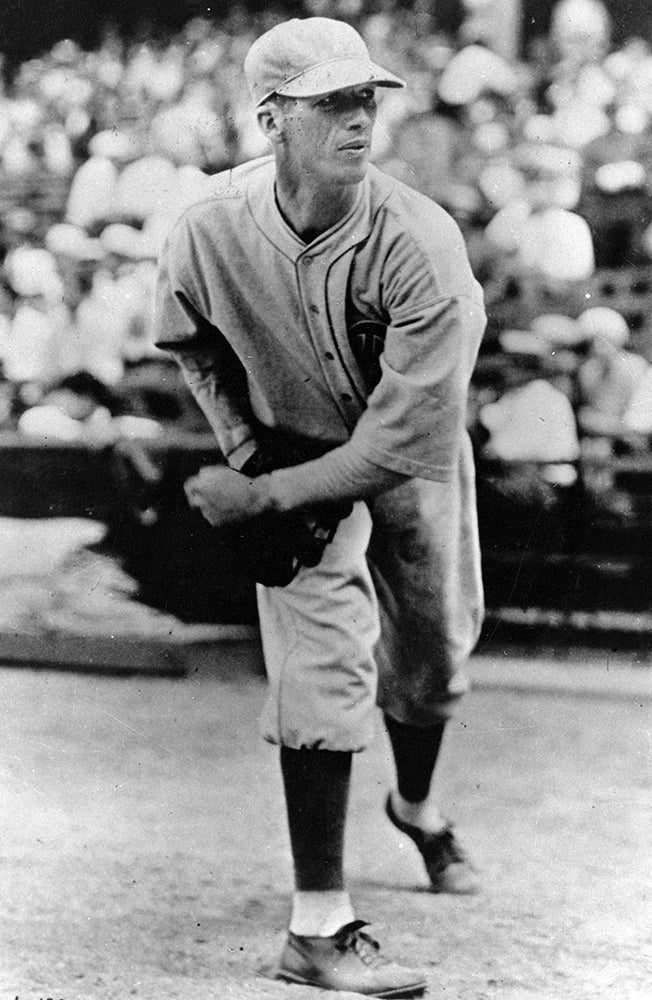
Lefty Grove, 1930 — Velocity as the Override
Robert Moses Grove grew up in the coal-mining town of Lonaconing, Maryland. He worked in a steel mill before the Philadelphia Athletics purchased his minor league contract for $100,600 after he went 108–36 with over a thousand strikeouts for the Baltimore Orioles.
Grove’s answer to the rabbit ball was the most elemental one available: he threw so hard that the physics barely mattered. His fastball was universally described as the fastest pitch anyone had ever seen. In a season when the lively ball rewarded contact—when even mediocre swings could leave the park—Grove threw pitches that arrived too fast to square up cleanly. The coefficient of restitution is irrelevant if you can’t center the ball on the barrel. The rabbit ball rewards contact; Grove prevented contact from happening.
He went 28–5, 2.54 ERA, 209 strikeouts—the pitching Triple Crown—in a league averaging 4.65. He made 18 relief appearances and recorded 9 saves on top of his starts. On September 1, two on, two out, Babe Ruth at the plate in Yankee Stadium, one-run lead: Grove struck him out on 2–2. From July 1930 through September 1931, his record was 46–4.
Grove also had gears. He didn’t throw maximum effort on every pitch—he saved his hardest fastball for the highest-leverage moments, so that even when the rabbit ball manufactured a baserunner, he could elevate his stuff and prevent the inning from cascading. He was efficient (70 strikes to 39 balls in one World Series start), strategic, and backed by the best team in baseball—the 102-win Athletics of Simmons, Foxx, and Cochrane.
His fiery temperament matched the fastball. He tore up clubhouses after losses. In a season where the run economy was inflated beyond reason, Grove refused to let the devalued currency erode his standard. He overpowered the phase change through sheer force.
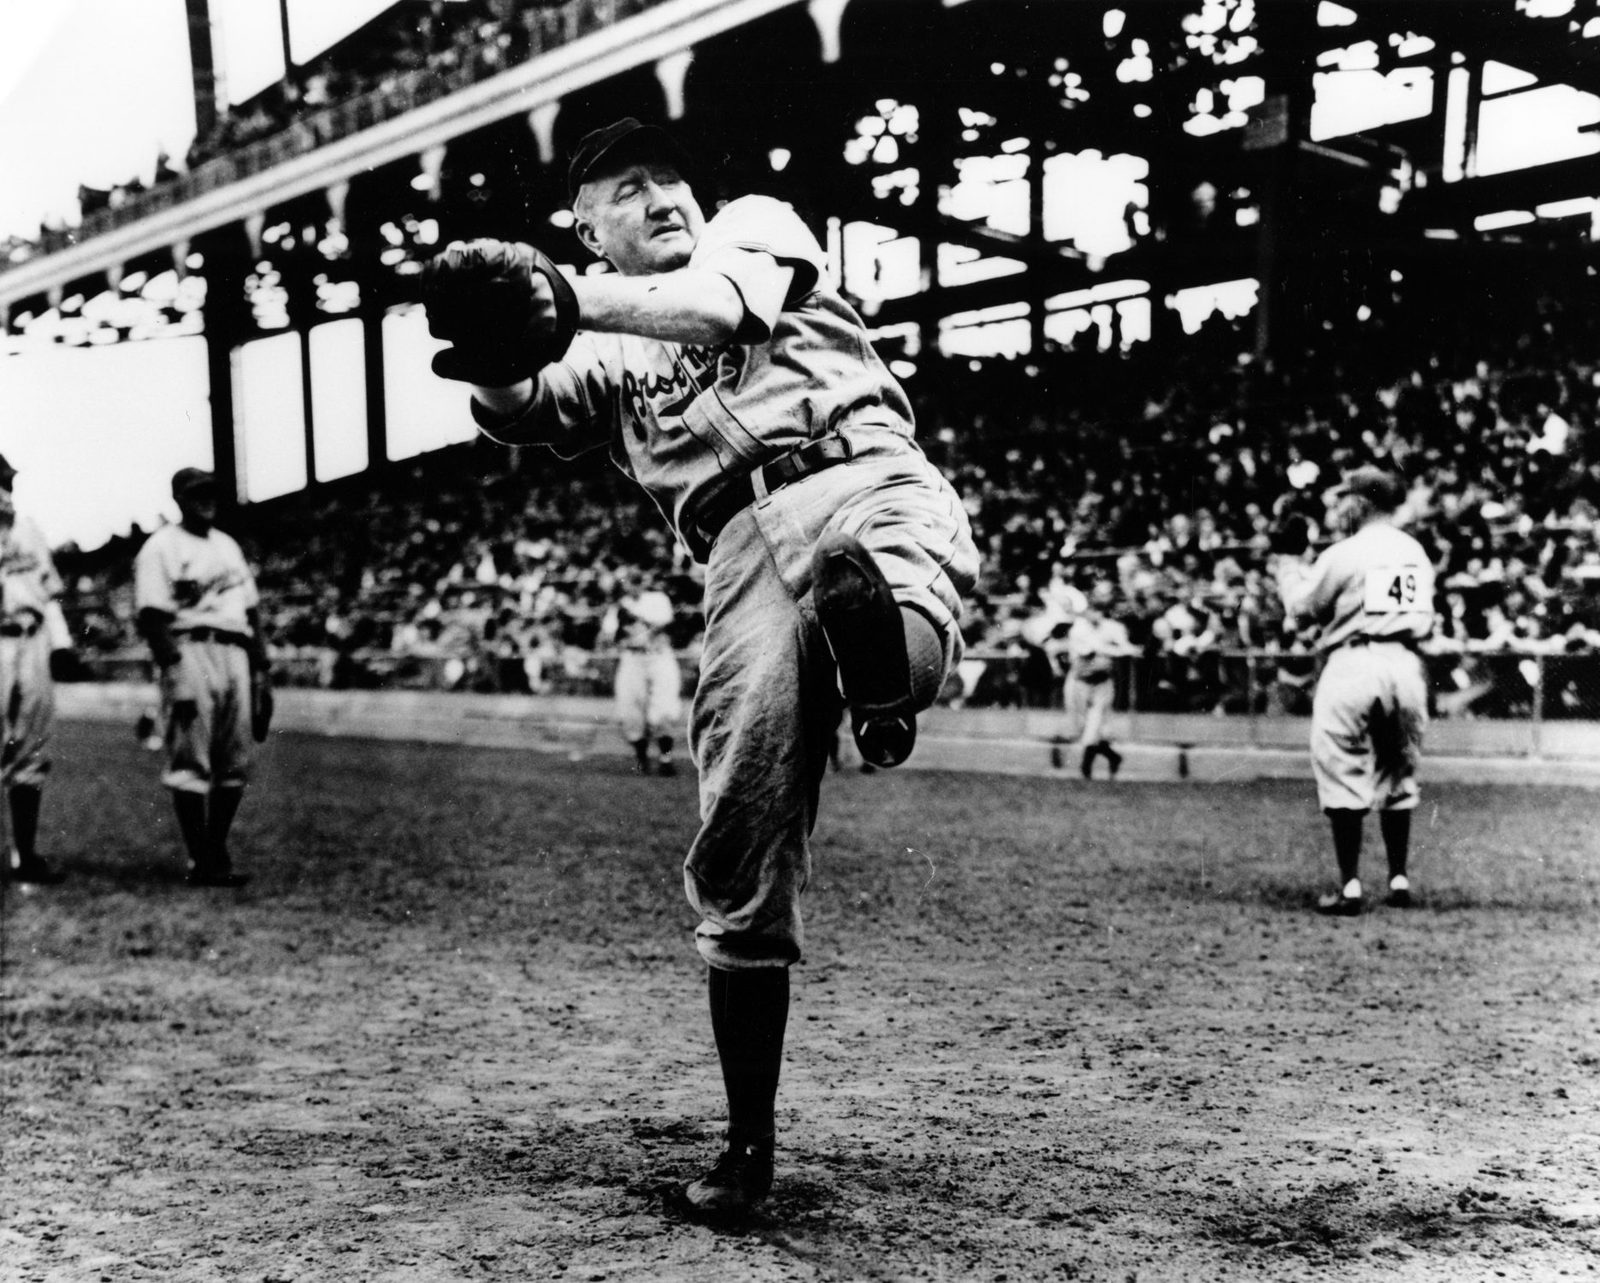
Dazzy Vance, 1930 — Deception as a Bypass
If Grove overpowered the rabbit ball, Dazzy Vance circumvented it—at thirty-nine years old, for a mediocre Brooklyn club, in the National League where the explosion was worse. The NL batted .303. Six of eight teams hit above .300. The league ERA was 4.97. Vance posted 2.61.
Vance spent a decade in the minors with a chronic arm injury before a poker-game mishap in New Orleans led to a doctor’s visit that fixed whatever was wrong. He arrived in Brooklyn at thirty-one, almost by accident—the Robins wanted his catcher, and the minor league club insisted they take the washed-up pitcher too. From 1922, Vance led the NL in strikeouts for seven consecutive seasons during the era of lowest sustained strikeout rates in modern history. In 1924, he fanned 262—more than any two NL pitchers combined—and won the MVP over Rogers Hornsby, who had batted .424.
Vance’s answer to the rabbit ball was deception so thorough that hitters couldn’t make the clean contact the juiced ball required. His fastball exploded off a high leg kick. His curveball broke sharply downward with the identical arm motion. And the famous ragged sleeve—a long-sleeved undershirt with the right arm cut into flapping white strips—camouflaged the white baseball against fluttering white fabric as it left his hand. The Cubs filed formal complaints. A rule was eventually passed. Vance shrugged and claimed the shirt was simply worn out.
The critical insight: the rabbit ball amplifies the damage of solid contact, but it cannot amplify contact that isn’t made. A swing and a miss is a swing and a miss regardless of the ball’s construction. Vance didn’t overpower the physics. He made the physics irrelevant by denying hitters the one thing the juiced ball needed: clean contact.
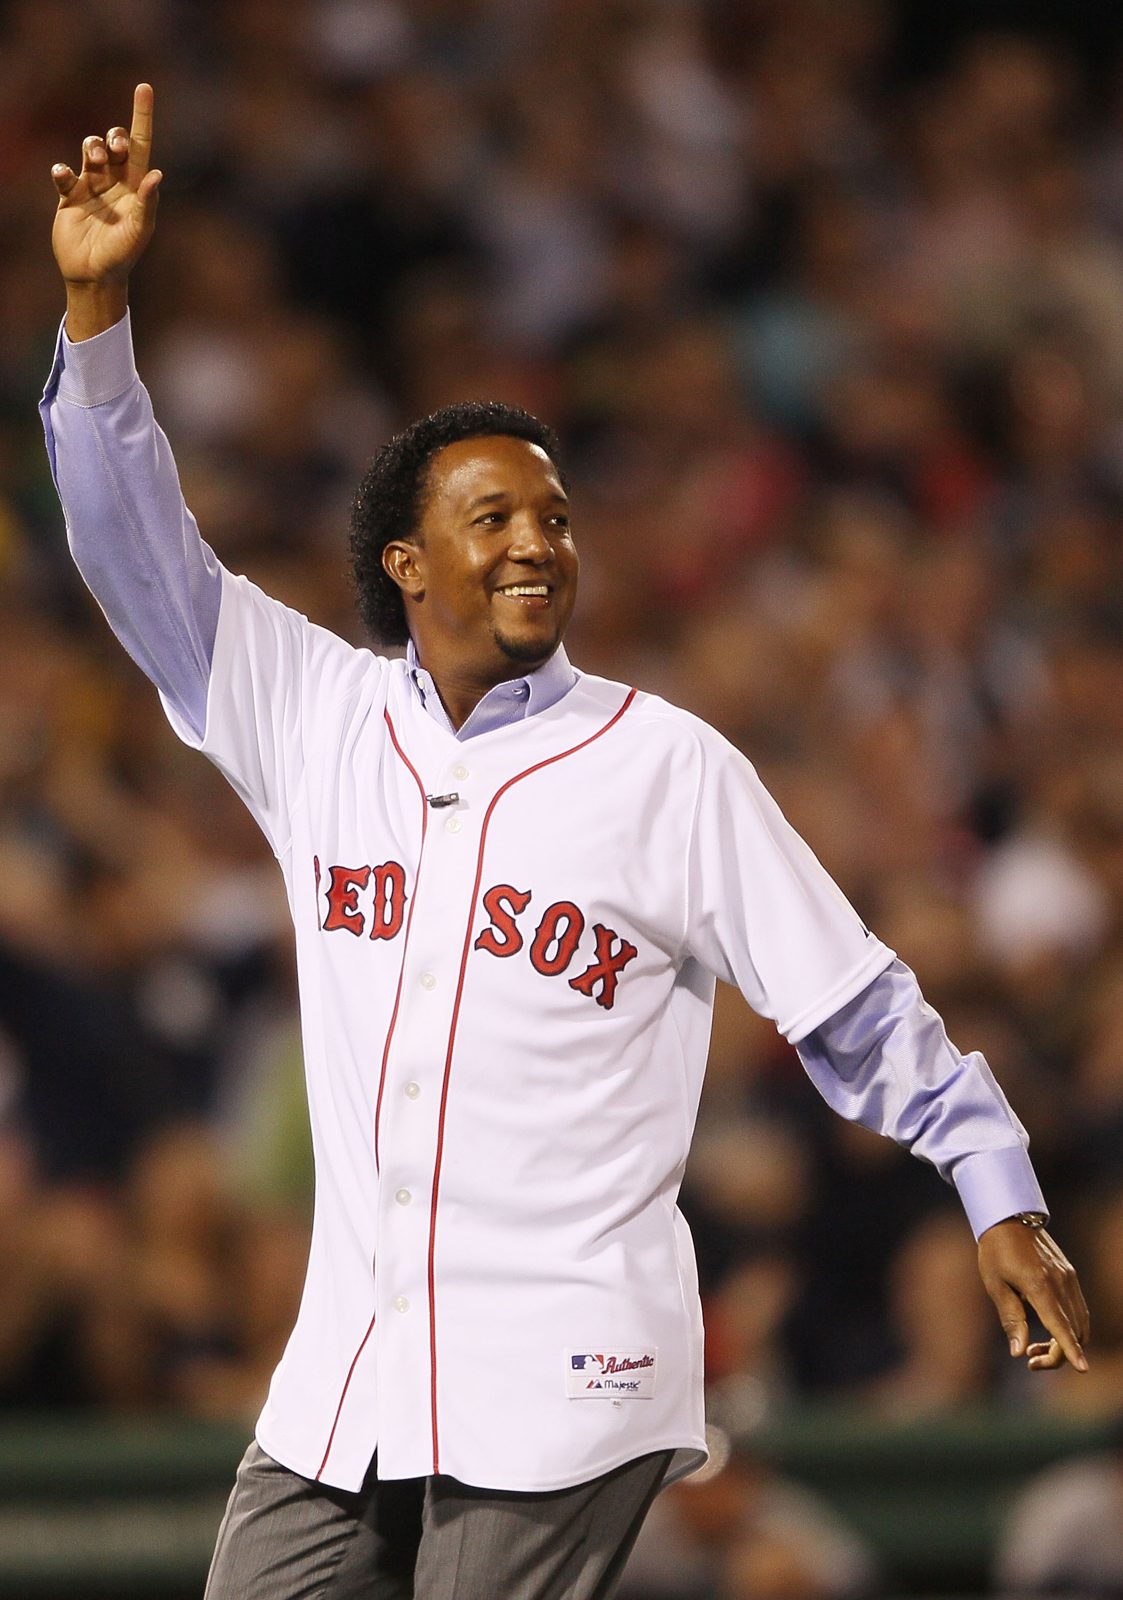
Pedro Martinez, 2000 — The Unsolvable Equation
Seven decades later, Pedro Jaime Martinez faced a rabbit-ball environment compounded by chemically enhanced sluggers, a designated hitter, and Fenway Park. He stood 5-foot-11, weighed 170 pounds, and produced the most dominant pitching season in baseball history.
Martinez went 18–6, 1.74 ERA, 284 strikeouts, 32 walks. He held hitters to a .167 average—lower than Bob Gibson’s .168 from 1968, the most pitcher-friendly season of the twentieth century. His 0.74 WHIP broke Walter Johnson’s 77-year-old record. He became the only starter in history to record more than twice as many strikeouts as hits allowed. His ERA+ of 291 is the highest since 1900. Roger Clemens finished second at 3.70—nearly two full runs behind, and closer to the league’s 38th-best ERA than to Pedro’s. Only five AL pitchers finished below 4.00. Pedro was alone below 2.50. He was playing a different sport.
Martinez combined Grove’s approach with Vance’s and added a dimension neither possessed. Like Grove, he had an overpowering fastball—mid-90s with pinpoint command. Like Vance, he was a master of deception, throwing from a low three-quarters slot that hid the ball. But Martinez had a five-pitch arsenal in which every offering was independently a dominant weapon: four-seam fastball, two-seam fastball, cutter, curveball, circle changeup. One former teammate said any one of Pedro’s three best pitches would have made an ordinary pitcher a 20-game winner. Pedro had all three plus two more.
The changeup—taught to him as a teenager by Guy Conti in the Dodgers’ system, who had learned the circle-change grip from Johnny Podres—may have been the single best pitch in baseball history. Thrown with the same arm speed and slot as the fastball, it dropped eight to ten inches and arrived ten miles per hour slower. Martinez could throw it with arm-side run or vertical break depending on his finger placement, giving him two variations of an already-unhittable pitch. He would switch grips mid-delivery to prevent baserunners from tipping the pitch to the batter—a feat of sleight-of-hand executed at full pitching speed.
Martinez didn’t just deny contact. He presented hitters with an unsolvable equation. Sit fastball, die on the changeup. Look changeup, get blown away. Split the difference, freeze on the curveball. The rabbit ball was irrelevant because hitters couldn’t solve for any variable.
He also understood the inflated run economy better than anyone. In a high-offense environment, every baserunner is more dangerous. So Martinez became historically stingy with baserunners: his .213 opponents’ on-base percentage was the lowest of the twentieth century. He didn’t just prevent runs. He prevented the conditions under which runs are scored. He attacked the inflation at its source.
Across 1999 and 2000, Martinez allowed 288 hits and 69 walks in 430 innings, struck out 597, and posted a combined 1.90 ERA with a 0.83 WHIP. Some statisticians believe this two-year stretch represents the absolute peak for any pitcher in baseball history. Given the environment—a compound rabbit-ball-and-steroid phase, a DH league, a bandbox park—the case is overwhelming.
Part VI: The System and Its Survivors
The Pattern
Baseball’s 130-year history is a weather system of phase changes, and the barometric pressure is set by the ball. The 1870s-1890s were chaotic oscillation—rules shifting annually, the pitcher-hitter relationship being negotiated in real time, scoring swinging wildly with every adjustment to distance, delivery, and construction. The 1900s-1910s were the Deadball settlement—a stable, deeply deflationary equilibrium in which the scuffed, doctored, overused ball suppressed offense to historically low levels and the game’s entire strategic identity organized around manufacturing single runs. The 1920s were the live-ball explosion—a sudden phase change triggered by the banned spitball, the clean-ball rule, and the livelier construction, with Ruth as the accelerant who demonstrated the strategic implications of the new physics. The escalation peaked in 1930, the singularity, after which the NL intervened with a paper-thickness of leather and the system snapped back.
Then the cycle repeated. The late 1990s and 2000s brought another compound disruption—a suspected juiced ball layered with steroids, a shrunken zone, diluted pitching, and smaller parks—and the run ecosystem inflated to 1930-like levels. The correction came late: drug testing in 2003, gradual normalization through the 2000s, and the lingering suspicion that the ball remains baseball’s unresolved variable.
The Survivors
In each of the two most extreme offensive environments, the list of pitchers who achieved genuine dominance is almost unbelievably small. Two in 1930. One in 2000. Three men across 130 years of baseball, out of the thousands who have taken the mound.
This is not coincidence, and it is not merely talent distribution. It is a direct consequence of the physics and economics of the rabbit ball. When the ball is juiced, the rate of force conversion shifts on every pitch. The run ecosystem inflates. Every pitcher’s numbers degrade regardless of his actual performance. To merely look average in a rabbit-ball phase, a pitcher must be genuinely good. To look good, he must be great. To look dominant—to post an ERA under 3.00 when the league approaches 5.00—he must be so transcendently skilled that the altered physics cannot close the gap.
Grove did it with velocity that overrode the ball’s liveliness because hitters couldn’t square him up. Vance did it with deception that bypassed the ball’s physics because hitters couldn’t make clean contact. Martinez did it with an unsolvable five-pitch arsenal that rendered the entire question academic, deployed against steroid-enhanced lineups swinging a ball that was almost certainly engineered to fly.
Baseball’s Persistent Lie
The rabbit ball is baseball’s most persistent and most dishonestly managed problem. It recurs because offense sells tickets—attendance peaked at 10.1 million in 1930; the McGwire-Sosa chase rescued the sport after the 1994 strike—and it is denied because admitting it would undermine the records set during each inflated phase. In 1930, Heydler described the fix as “a paper-thickness of leather,” and that paper produced a 26-point drop in batting average and a 45 percent reduction in home runs. In the 2000s, MLB commissioned a report finding no significant changes in the ball, even as independent studies found otherwise.
Each time, the game corrects course. The NL deadened the ball after 1930; the Great Depression then deepened the austerity, cratering attendance from 10.1 million to 6.1 million by 1933 and forcing the innovations—night games, the All-Star Game, radio broadcasts, the farm system—that would reshape the sport permanently. The steroid era ended with congressional hearings, the Mitchell Report, and mandatory testing. None of the three most prominent home-run record holders—Bonds, McGwire, Sosa—have been voted into the Hall of Fame.
But the ball remains the unresolved variable. It is the one factor the sport has never been willing to fully confront, because confronting it means admitting that baseball’s most sacred statistics have always been, in part, a function of manufacturing specifications.
Epilogue: The Most Exclusive Club in Baseball
The rabbit ball is a physics problem. It changes the rate of force conversion between bat and ball on every pitch, in every at-bat, in every game. It is an economic problem. It inflates the run ecosystem, devalues the currency of pitching performance, and reorganizes the strategic architecture of the sport around power at the expense of everything else. It is baseball’s oldest and most persistent manipulation—a control variable that has been adjusted, denied, and adjusted again across every era of the game’s history.
And the list of pitchers who have beaten it—who have posted truly dominant seasons in the most extreme rabbit-ball environments the sport has ever produced—is the most exclusive club in baseball. More exclusive than the 500-homer club, or the 300-win club, or the Hall of Fame itself.
It has three members: Lefty Grove, Dazzy Vance, and Pedro Martinez.
Admission requires defying the laws of the game itself.