Pitchers as Seismographs: Kid Nichols, Walter Johnson, and the Physics of Baseball’s Moving Sky
Pitchers as Seismographs: Kid Nichols, Walter Johnson, and the Physics of Baseball’s Moving Sky
Pitchers as Seismographs
Kid Nichols, Walter Johnson, and the Physics of Baseball’s Moving Sky
Baseball history is not a continuous statistical field.
It is a sequence of atmospheric regimes — compressed and expanded run climates created by rule changes, equipment shifts, and structural evolution. If we want to understand those regimes clearly, we must identify the correct instrument.
Hitters show the weather.
Pitchers show the tectonic plate shifts.
The 19th and early 20th centuries prove this with unusual clarity. Two careers — separated by a generation — function as clean experimental controls.
Kid Nichols
Walter Johnson
Together, they demonstrate that pitchers are the primary climate index of baseball history.
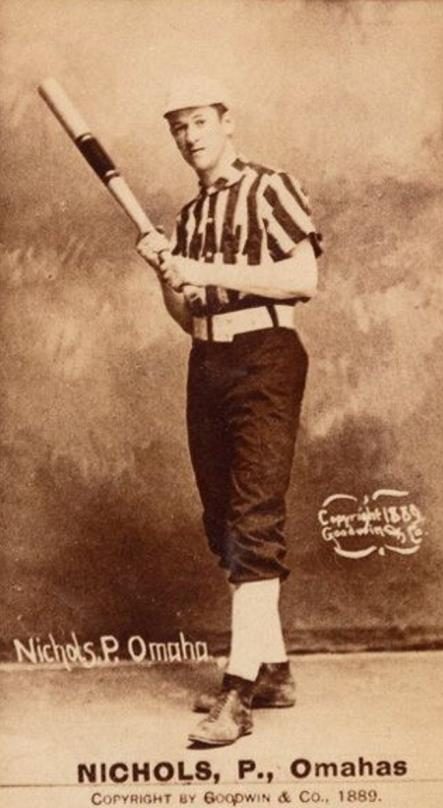
I. The 1893 Distance Shock — Nichols as Test Subject
In 1893, the pitching distance was moved permanently from 50 feet to 60 feet 6 inches.
This was not cosmetic. It expanded the hitter’s reaction window and reduced perceived velocity at the plate. The run environment widened immediately.
Nichols’ ERA line records the rupture:
1890–1892: ERAs in the low 2s
1893: 3.52
1894: 4.75
1895: 3.41
1896–1898: back under 3
The spike is not skill decay. It is atmospheric expansion.
The mound moved. The sky widened. Run suppression compressed.
Nichols’ later stabilization shows league adaptation. Command evolved. Defensive positioning hardened. The ecosystem recalibrated to the new geometry.
One arm recorded the fracture and the healing.
Hitters in 1894 simply look “better.” But their improvement cannot isolate whether the environment changed. Nichols’ ERA isolates it instantly.
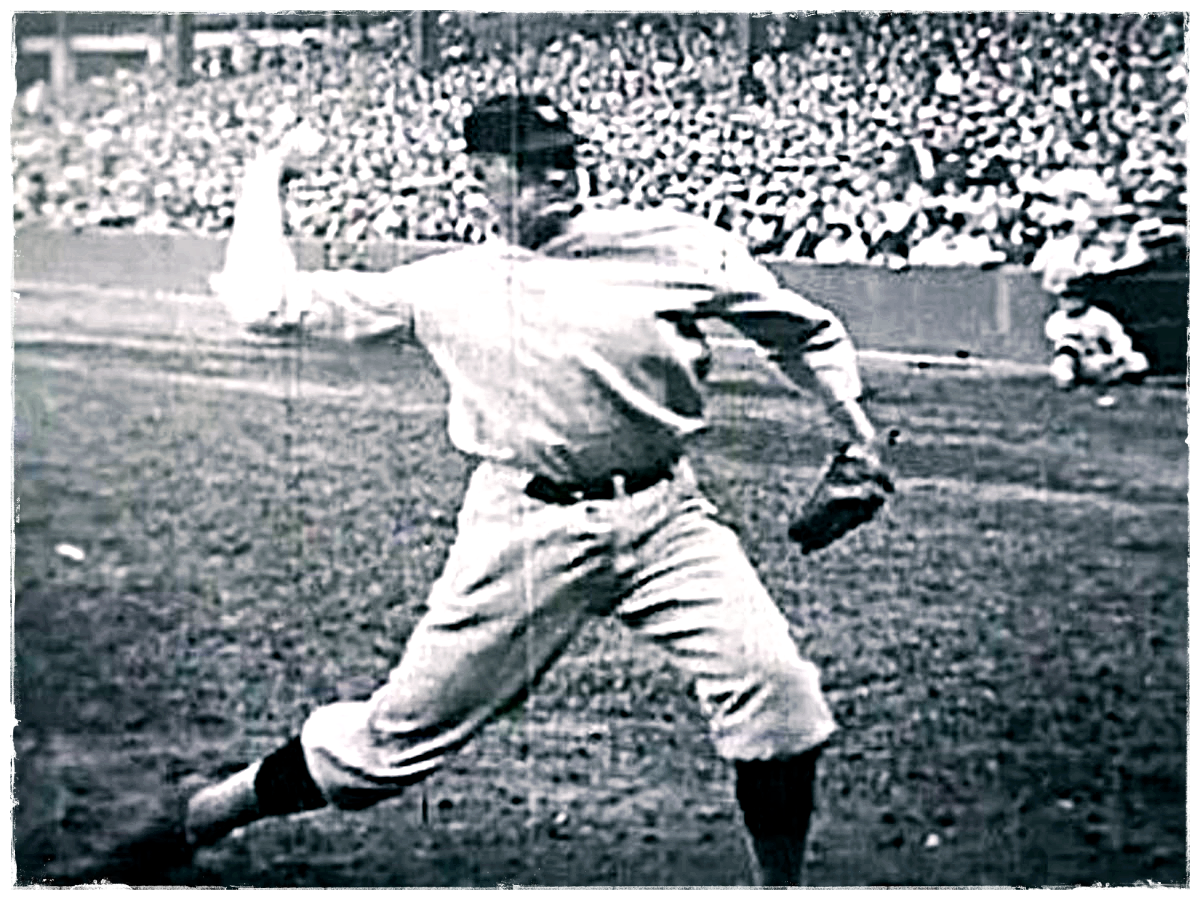
II. The 1920 Live-Ball Shock — Johnson as Control
The Deadball era (1900–1919) was a compressed scoring field, averaging roughly 3.7 runs per game. Resistance density was high. Run suppression was structurally easier to sustain.
Walter Johnson’s late-Deadball dominance illustrates this compression:
1918: 1.27 ERA
1919: 1.49 ERA
Then 1920 arrives.
Ball construction changes. Home run rates climb. Run scoring expands dramatically.
Johnson’s ERA in 1920: 3.13.
The number doubles in one season.
This is not decline. It is atmospheric widening.
Same arm. Same pitcher. Different sky.
Again, hitters appear improved. But only the pitcher’s line shows the rupture cleanly.
III. Why Pitchers Reveal Structure Better Than Hitters
In unstable or shifting regimes, pitchers directly oppose the run climate. They measure resistance.
When:
Distance changes
Ball physics change
Strike zone rules evolve
Competitive density hardens
Pitching statistics respond immediately.
Hitters benefit from widened space. Pitchers absorb widened space.
Therefore:
Offensive spikes can be ambiguous (skill vs environment).
Run suppression spikes are diagnostic (environment changed).
Pitchers are pressure gauges.
IV. The 19th Century Reframed
The 19th century was not simply “high offense” or “statistical chaos.”
It was a rule-evolution laboratory:
Distance reconfiguration (1893)
Strike zone instability
Ball variability
Shallow competitive density
Massive inning workloads
Nichols’ 45–50 complete-game seasons reveal an ecosystem not yet hardened into modern distributed resistance.
When the geometry shifted, his ERA shifted.
That is structural evidence.
V. The Moving Sky Principle
Baseball operates within a run climate — a scoring atmosphere defined by geometry and physics.
When the sky expands:
League runs rise.
ERA rises.
Suppression compresses.
When the sky compresses:
League runs fall.
ERA collapses.
Suppression expands.
Pitchers trace that movement with precision.
Nichols records the geometric expansion of 1893.
Johnson records the ball-physics expansion of 1920.
Together, they prove that pitchers are the seismographs of baseball history.
Conclusion
To understand early baseball environments, do not begin with batting averages. Begin with the arms forced to resist a moving horizon.
Kid Nichols and Walter Johnson each demonstrate the same structural law:
When the sky moves, pitchers show it first.
Baseball history is not merely a narrative of stars. It is a physics story. And the clearest instruments of that physics are the pitchers who absorbed its shocks.
This is not preference. It is diagnostic clarity.