Rate Dominance, Volatility, and Structural Boundaries: What Pete Hill and Willie Foster Reveal About Measuring Greatness in Negro League Data
Rate Dominance, Volatility, and Structural Boundaries: What Pete Hill and Willie Foster Reveal About Measuring Greatness in Negro League Data
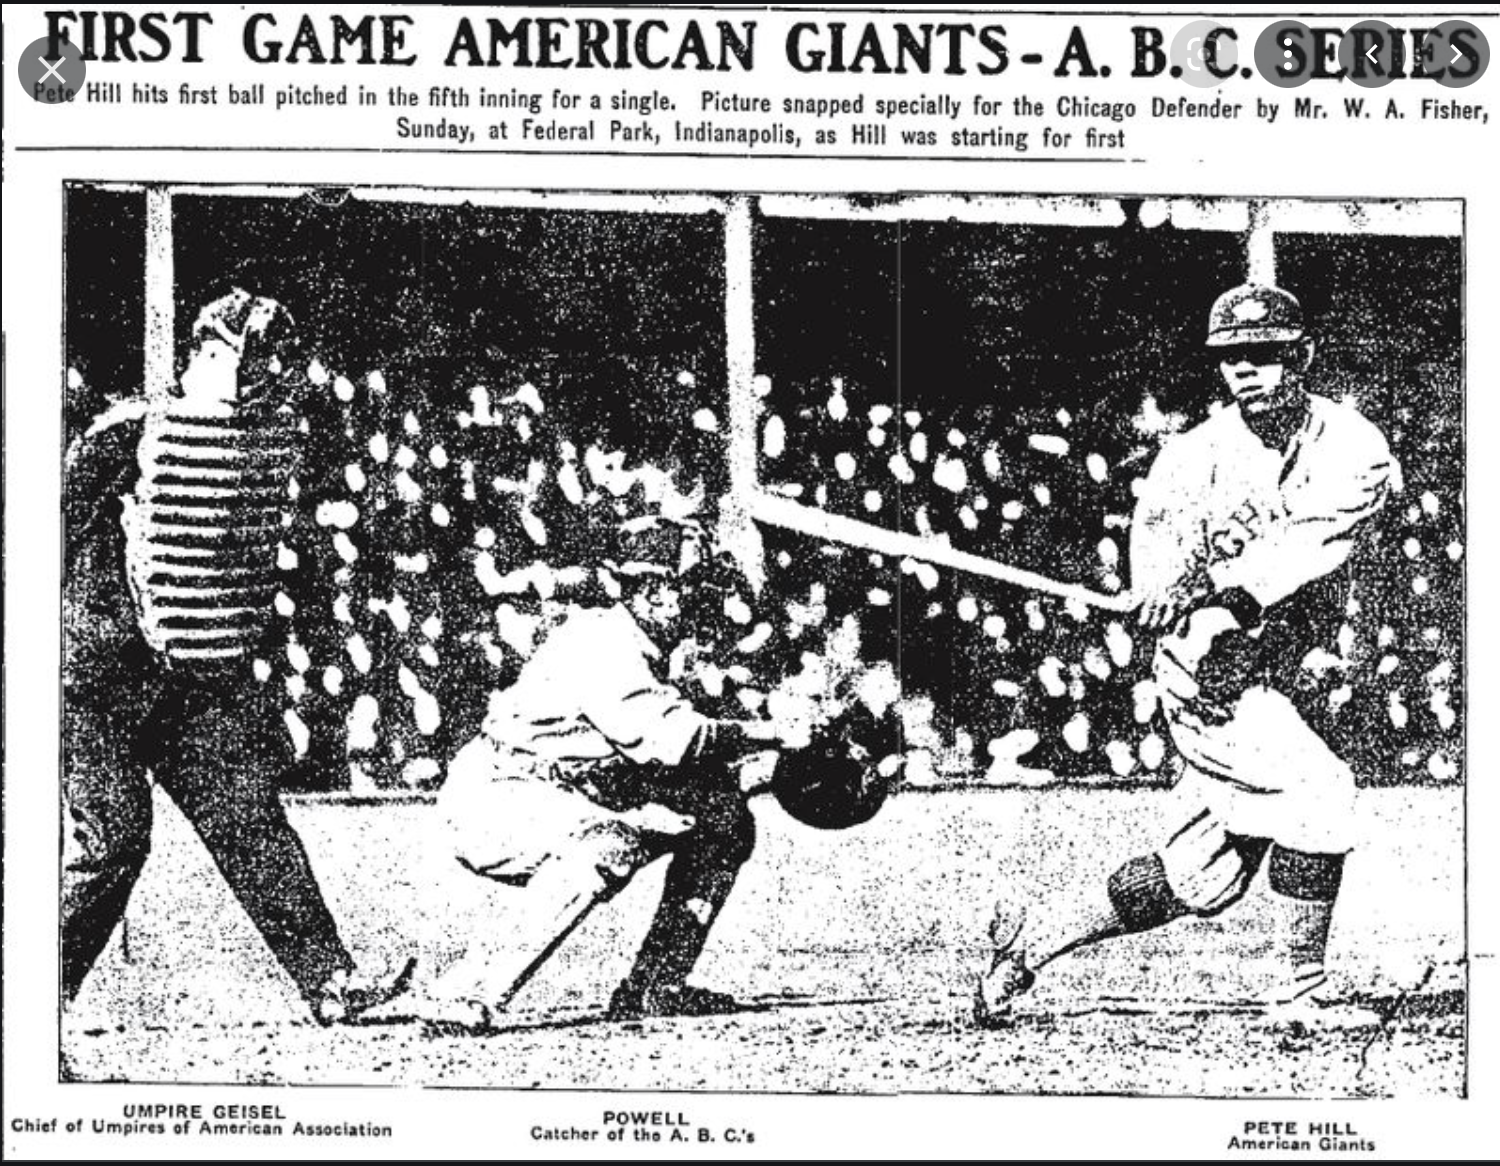

Rate Dominance, Volatility, and Structural Boundaries
What Pete Hill and Willie Foster Reveal About Measuring Greatness in Negro League Data
Abstract
OPS+ and ERA+ are powerful normalization tools. They scale performance relative to league average and allow cross-era comparison within defined competitive fields.
But when applied to short-season Negro League data—especially at the seasonal level—these metrics exhibit extreme volatility driven by denominator instability, fragmented schedules, and database inclusion differences.
Using:
Pete Hill’s 171 career OPS+ (Seamheads)
Willie Foster’s contrasting ERA+ signatures (164 at ~1,499 IP on Baseball Reference vs 130 at ~2,027 IP on Seamheads)
this essay clarifies:
The difference between seasonal volatility and sustained dominance
How inclusion philosophy alters relative metrics
Why ERA+ and OPS+ are universe-dependent
Why structural boundary analysis must rely on volume-gated career aggregates
The central claim is precise:
Seasonal rate explosions do not define structural ceilings.
Sustained, volume-stabilized career aggregates do.
I. The Nature of Relative Rate Metrics
OPS+ and ERA+ are ratio statistics.
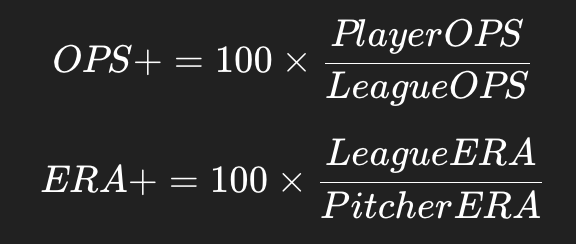
They depend on:
The player’s rate
The league baseline
The denominator (PA or IP)
Because they are ratios, they are denominator-sensitive.
When sample sizes shrink:
One hot stretch inflates OPS+ dramatically
One dominant stretch inflates ERA+
One poor outing collapses a season
This is mathematics—not narrative.
Short-season leagues amplify this property.
II. Willie Foster and Seasonal Volatility
Consider Willie Foster’s Negro League ERA+ from Baseball Reference:
1925 — 78 IP, ERA 1.62, ERA+ 327
1926 — 174.2 IP, ERA+ 252
1927 — 217 IP, ERA+ 184
These are enormous seasonal peaks.
But they occur in:
Short league schedules
Smaller denominators
Fragmented competition pools
Official league games only
A 78-inning season is inherently volatile.
Now compare this to his Seamheads career aggregation:
2027 IP
ERA 2.71
ERA+ 130
The volatility smooths.
The dominance stabilizes.
The seasonal 327 ERA+ does not define Foster’s structural ceiling.
The career 130 ERA+ does.
III. The Foster 164 vs 130 ERA+ Difference Explained
This discrepancy is critical.
On Baseball Reference (Negro League scope):
~1,499 IP
Career ERA+ ≈ 164
On Seamheads:
~2,027 IP
Career ERA+ ≈ 130
This is not contradiction.
It is scope.
ERA+ is relative to a defined competitive universe.
When you change:
Which games are included
Which league baseline is calculated
Which opponent pool is counted
How many innings are aggregated
you change ERA+.
What BRef Measures
Baseball Reference:
Official Negro League games only
Narrower competition pool
Smaller denominator
League-only baseline
This produces a “league-dominance signature.”
What Seamheads Measures
Seamheads:
Broader game inclusion
Larger denominators
Expanded opponent diversity
Different league baseline construction
This produces a “broad-scope dominance signature.”
ERA+ is not a fixed property of the pitcher.
It is relative geometry.
Change the geometry → change the value.
Both 164 and 130 are internally correct within their competitive frames.
They answer different questions.
IV. Pete Hill: Seasonal Spikes vs Structural Signal
Pete Hill’s Seamheads career OPS+ = 171.
Seasonally, he posted:
205 OPS+
204 OPS+
197 OPS+
229 OPS+
Even 300+ in very small samples
These illustrate volatility.
But his sustained, volume-stabilized career settles at 171.
That number:
Aggregates his prime
Smooths denominator instability
Filters seasonal spikes
Reflects long-horizon dominance
The seasonal peaks are episodic.
The 171 is structural.
V. Volatility Is Not Boundary
Short-season Negro League environments produce:
Higher coefficient of variation
Frequent 200+ and 300+ spikes
Greater denominator instability
But structural ceilings are revealed only after variance is smoothed across:
Multi-year aggregation
Volume gates
Stable denominators
Live-ball MLB allowed sustained nonlinear SLG expansion that accumulated into:
Ruth career OPS+ 206
Williams career OPS+ 191
Deadball + Negro League structure allowed:
Episodic spikes
But lower sustained career-level extreme accumulation
The boundary difference appears in long-run stabilization—not seasonal outliers.
VI. What Volume Actually Does
Volume:
Reduces denominator volatility
Dilutes short-run variance
Converts episodic dominance into structural signature
If a pitcher sustains 200+ ERA+ over 2,000 IP, that defines boundary.
If he posts 327 ERA+ over 78 IP, that defines volatility.
Both are impressive.
Only one defines geometry.
VII. The Deeper Methodological Point
ERA+ and OPS+ are universe-dependent metrics.
When comparing eras or leagues, we must:
Use consistent inclusion frameworks
Apply volume gates
Stabilize denominators
Recognize baseline construction differences
Otherwise, we are comparing metrics built on different geometries.
Structural boundary analysis requires:
Volume-stabilized career aggregates within a consistent competitive frame.
VIII. Final Clarification
Negro League environments did not prevent dominance.
They did not prevent 200+ seasonal spikes.
But when denominators stabilize and careers aggregate:
Sustained extreme right-tail accumulation appears narrower than in Live-ball MLB
Rate volatility compresses toward long-run means
Structural ceilings emerge only through volume
Pete Hill’s 171 career OPS+ is not contradicted by his seasonal spikes.
Willie Foster’s 130 ERA+ (Seamheads) and 164 ERA+ (BRef) reflect different competitive universes—not conflicting truths.
Volatility is episodic.
Structure is sustained.
Conclusion
OPS+ and ERA+ remain indispensable.
But in short-season, fragmented competitive environments:
Seasonal rate metrics exaggerate volatility
Inclusion philosophy alters dominance signatures
Database scope changes baseline geometry
Only volume-gated career aggregation reveals structural ceilings.
If we wish to evaluate cross-era dominance rigorously:
We must distinguish episodic rate explosions from sustained structural boundaries.
Only then does the geometry hold.