Scarcity-Adjusted Dominance Index (SADI): A Reproducible Elite-Definition Model for Negro League Pitching
Scarcity-Adjusted Dominance Index (SADI): A Reproducible Elite-Definition Model for Negro League Pitching

Scarcity-Adjusted Dominance Index (SADI)
A Reproducible Elite-Definition Model for Negro League Pitching
I. The Problem: Why ERA+ Alone Under-Separates
Negro League pitching records are structurally noisy: uneven seasons, missing games, uncertain league baselines, and higher variance from smaller samples.
ERA+ remains the best single outcome metric we possess. But under these conditions, ERA+ becomes compressed. It flattens distinctions between:
great pitchers
elite pitchers
structural outliers
ERA+ is not flawed.
It is incomplete under conditions of structural data scarcity.
To construct a meaningful elite definition, we correct two failure modes:
Scarcity fragility — small or uneven workloads inflate extremes.
Outcome-only ambiguity — run prevention without skill context hides structural dominance.
II. Method
Inputs
From Seamheads career tables:
ERA+
IP
BF
K
BB
HR
Step 1 — Shrink ERA+ Toward 100
We correct for scarcity by shrinking ERA+ toward the league mean (100) using a prior innings constant:

Interpretation:
High-volume pitchers retain separation.
Lower-volume pitchers are pulled toward 100.
Extreme outliers require both dominance and durability.
Step 2 — Compute Defense-Independent Skill Rates
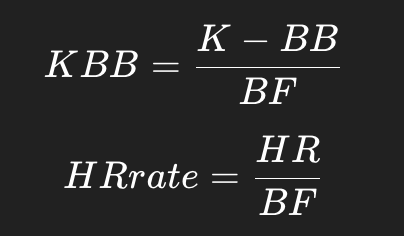
K–BB captures dominance independent of defense.
HR suppression captures run-prevention stability.
Step 3 — Shrink Skill Rates
Because BF volume also varies, we shrink skill rates toward dataset means using BF₀ = 3000:

This prevents small-sample skill inflation.
Step 4 — Standardize
We convert all corrected components to z-scores:
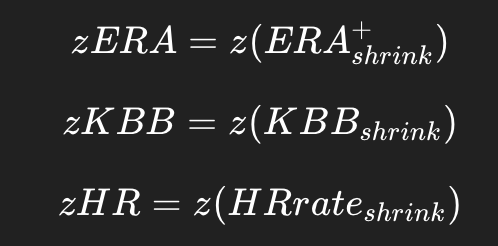
All components now live on a common scale.
All means and standard deviations are computed within the top 30–pitcher dataset (Seamheads), selected by career ERA+ with a minimum of 1,000 innings pitched. Population standard deviation (σ) is used.
Step 5 — Composite: SADI

Mean ≈ 100
1 SD ≈ 15
ERA+ remains primary.
K–BB confirms skill.
HR moderates risk.
III. Results (Top 10)
Satchel Paige — 2.659σ (139.88)
Joe Williams — 1.569σ (123.54)
José Méndez — 1.310σ (119.66)
Bullet Rogan — 0.983σ
Ray Brown — 0.772σ
Hilton Smith — 0.728σ
Carlos Royer — 0.679σ
Martín Dihigo — 0.484σ
Willie Foster — 0.422σ
Juan Padrón — 0.362σ
IV. The Structural Finding
The separation is statistically real.
Paige: 2.66σ
Williams: 1.57σ
Méndez: 1.31σ
Paige separates from #2 by ~1.09 standard deviations.
This separation persists under shrinkage, skill correction, and full standardization.
It therefore reflects structural dominance rather than scale artifact.
V. Tier Structure
Tier 1 — Structural Apex (≥ 2σ): Paige alone
Tier 2 — True Elite (1.3–2σ): Williams, Méndez
Tier 3 — High Elite (0.7–1.3σ): Rogan, Brown, Smith, Royer
Tier 4 — Great Aces (0.35–0.7σ): Dihigo, Foster, Padrón
The elite pocket is small.
It survives shrinkage.
It survives skill correction.
It survives standardization.
And Paige still clears everyone.