The Complete Hitter: Baseball’s Smallest and Most Stable Archetype
The Complete Hitter: Baseball’s Smallest and Most Stable Archetype
The Complete Hitter: Baseball’s Smallest and Most Stable Archetype
Baseball history is usually told through extremes.
The biggest power.
The highest averages.
The most total value.
But those are single-axis achievements. They describe peaks , not solutions.
If we instead ask a different question—
What does it mean to fully solve the act of hitting?
—we are forced into a much narrower space.
Defining the Problem
Hitting is not one skill. It is the integration of three competing demands:
Conversion → turning swings into hits (batting average)
Force → generating meaningful outcomes (slugging)
Frequency → sustaining production over time (hits per game)
Most hitters optimize one or two.
Very few sustain all three.
To isolate that rare class, we apply four constraints:
Batting Average ≥ .340
Slugging ≥ .500
Hits per Game ≥ ~1.27
Sustained career scale
This is not a measure of overall offense.
It is a measure of contact-generated production held at scale.
The Result: A Collapse to Eight
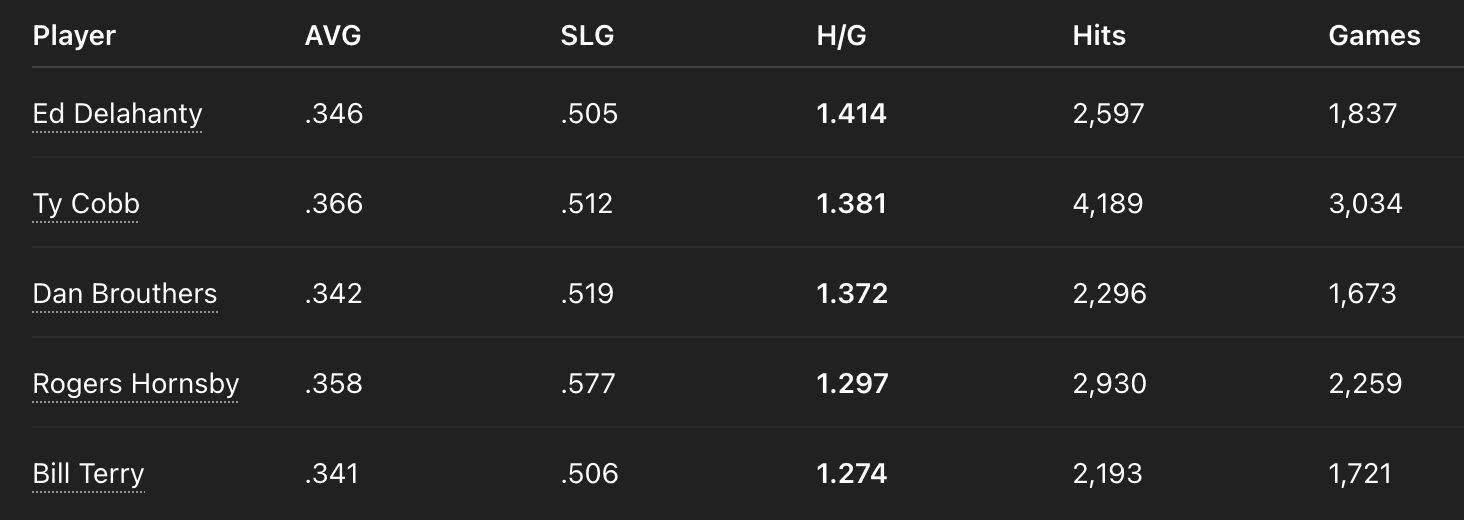
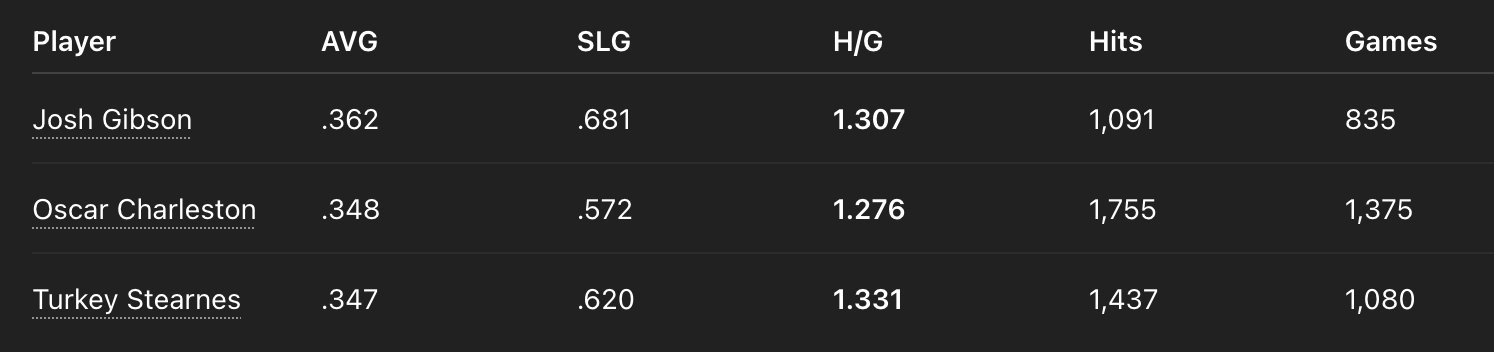
Across both Major League and Negro League history, the list compresses to just eight players.
Major League Core
Negro League Core
That’s it.
Not dozens. Not even ten.
Eight.
Why So Few?
Because the constraints conflict.
Increasing power reduces average
Increasing frequency reduces damage
Sustaining both over time invites regression
Most players eventually “pay” somewhere:
Contact specialists lack force
Power hitters lose frequency
Rate monsters fail to sustain scale
Only a handful avoid all three failure modes.
The Shape of the Group
Even within the eight, structure appears:
Upper Tier — High-Frequency Dominance
Delahanty — 1.414 H/G
Cobb — 1.381 H/G
Brouthers — 1.372 H/G
Stearnes — 1.331 H/G
These players push hit frequency toward its upper limit while still clearing the power threshold.
Middle Tier — Integrated Balance
Hornsby — 1.297 H/G , .577 SLG
Gibson — 1.307 H/G , .681 SLG
These represent the cleanest blends of average and force , without sacrificing frequency.
Lower Boundary — Structural Floor
Terry — 1.274 H/G
Charleston — 1.276 H/G
This is the edge.
Below ~1.27 H/G, the system begins to fracture.
Why Bill Terry Matters
Terry is the key to understanding the entire structure.
He is not the best hitter here.
He is not the most dominant.
He does not lead any category.
And yet:
.341 AVG
.506 SLG
1.274 H/G
He clears every threshold— barely, but completely.
Terry proves this is not a list of outliers—it is a stable form.
Without him, this looks like mythology.
With him, it becomes:
a reproducible configuration
He represents:
the minimum viable complete hitter
What This Reveals About Hitting
This exercise uncovers something deeper than rankings:
Hitting has a constrained solution space.
Across:
different eras
different leagues
segregated baseball systems
…the same statistical shape appears.
Not because these players were identical, but because:
they independently arrived at the same equilibrium
Two Different Games at the Plate
Traditional metrics measure:
total offensive value (OBP, wRC+, etc.)
This model isolates:
contact-generated production
That distinction explains everything.
Players like:
Babe Ruth
Ted Williams
dominate offense—but not this system.
Because they optimized:
walks + power efficiency , not hit production frequency
Final Formulation
There are many great hitters in baseball history.
But only a small number fully integrate
conversion, force, and frequency over time.Those players do not simply excel—
they occupy the complete solution to hitting itself.
Conclusion
Eight players.
Across all of baseball history.
All meeting:
.340+ average
.500+ slugging
~1.27+ hits per game
sustained production
Not a list of legends.
A map of the limits of hitting.
Addendum: The Constraint Surface of Hitting
The result of this exercise is not the list.
The list is the symptom.
What has been uncovered is something more fundamental:
Hitting operates inside a constrained solution space, and only a few players ever fully occupy it.
1. What “constrained solution space” actually means
Every swing is governed by competing physical and probabilistic limits:
You can increase contact rate
→ but often at the cost of impactYou can increase impact (power)
→ but at the cost of contact frequencyYou can increase selectivity (walks, pitch filtering)
→ but at the cost of balls put into play
These are not stylistic differences.
They are:
tradeoff boundaries imposed by time, mechanics, and decision-making
2. The three axes form a closed system
The model identifies three irreducible components:
Conversion (BA) → probability of success per swing
Force (SLG) → energy per success
Frequency (H/G) → rate of realized events
These are not independent.
They form a closed system , meaning:
Increasing one tends to reduce at least one of the others.
3. Most players live on the edges
Because of those constraints, players specialize:
Contact edge
high BA
high H/G
low SLG
Power edge
high SLG
lower BA
lower H/G
Plate-discipline edge
high OBP
fewer balls in play
different optimization entirely
These are stable but incomplete solutions.
4. The integrators occupy the interior
These eight players are different.
They do not maximize one axis.
They:
maintain all three above threshold simultaneously
This places them not on the edges, but:
inside the volume of the system
That is why the group is so small.
5. Why the same profile appears across eras
We have:
19th century players (Brouthers, Delahanty)
deadball/live-ball bridge (Cobb)
live-ball era (Hornsby, Terry)
Negro League stars (Gibson, Charleston, Stearnes)
Different:
pitching styles
travel conditions
equipment
league structures
And yet:
the same statistical shape appears
Why that happens
Because the constraints are not historical.
They are:
human and physical
reaction time
bat speed
pitch recognition
swing path optimization
decision latency
No matter the era, a hitter must solve:
how to produce contact often, with impact, without collapsing either dimension
6. Independent convergence
This is the key phrase:
“they independently arrived at the same equilibrium”
None of these players were copying each other across leagues or generations.
Instead:
each navigated the same constraints
each pushed against the same limits
each found a viable balance point
And those balance points:
converge to the same region of performance
7. Why the group is so small
Because the interior of the system is tiny.
Think of it like a volume:
the edges (specialists) are large
the interior (integrators) is extremely small
To exist there, a player must:
avoid over-optimizing any axis
avoid collapsing any axis
sustain it over time
That is:
a narrow corridor of possibility
8. Terry as the stabilizing proof
This is where Terry becomes essential again.
Delahanty, Cobb, Hornsby → could be seen as peaks
Gibson, Stearnes → could be seen as extraordinary talent
But Terry shows:
you don’t need extremity—you need balance without failure
He proves the solution is not just a spike.
It is:
a stable configuration
9. The hidden geometry of hitting
You can visualize this as a 3D space:
X-axis → conversion (BA)
Y-axis → force (SLG)
Z-axis → frequency (H/G)
Most players lie along surfaces or edges.
The integrators occupy a small interior cluster.
That cluster is:
the equilibrium zone of hitting
10. Final deep formulation
Hitting is not an open-ended skill—it is a constrained system with competing demands.
Most players resolve those demands by specializing.
A rare few resolve them by balancing all forces simultaneously.
Those players do not just excel—they occupy the only stable interior solution the system allows.
Addendum II: Constraint Physics — Pitcher as Enforcer, Batter as Reactor
The pitcher is the enforcer of constraint physics.
The batter is the reactor.
This is not metaphor—it’s the actual structure of the game.
1. The pitcher creates the constraint field
Every pitch is a moving boundary condition:
velocity compresses time
movement distorts the contact window
location reshapes the decision space
The pitcher is not just “opposing” the hitter.
He is:
actively tightening the allowable solution space on every pitch
2. The batter does not act freely
The batter is not initiating action in open space.
He is:
reacting inside a collapsing time window under constraint
At ~90+ mph:
~400 milliseconds from release to plate
decision must occur ~150–200 ms in
swing must commit before full trajectory is known
This means:
hitting is a forced reaction, not a free action
3. Why the three axes are constrained
Now the model becomes fully grounded.
Conversion (BA)
→ can only be high if the batter:
reads the pitch early
matches plane under time pressure
Force (SLG)
→ requires:
optimal contact point
full kinetic transfer
But:
the harder you swing, the less time you have to adjust
Frequency (H/G)
→ requires:
- consistent success across many constrained events
4. The tradeoff is enforced externally
This is the key:
The batter does not choose the tradeoff—the pitcher imposes it.
High velocity → reduces contact probability
Late movement → reduces quality of contact
Location variation → increases decision error
So when a hitter loses:
average
or power
or frequency
…it is not random.
It is:
the constraint field overwhelming one axis of their system
5. What the integrators are actually doing
The eight players are not just “great hitters.”
They are:
the most stable reactors under maximum constraint
They can:
read earlier
adjust faster
maintain swing integrity under uncertainty
And crucially:
they do not overcommit to any one solution
6. Why specialists fail under pressure
Contact specialists
shorten swing
prioritize touch
→ survive velocity, but lose force
Power hitters
commit early
maximize energy
→ gain force, but lose contact frequency
OBP specialists
filter pitches
avoid bad swings
→ reduce exposure, but also reduce event frequency
Each is a partial adaptation to constraint.
7. Integrators solve the constraint holistically
The eight integrators do something rarer:
They maintain adaptability across all constraint types simultaneously.
They can:
handle velocity
adjust to movement
still square the ball
still generate force
Without collapsing any axis.
8. Why the same players appear across eras
Because the constraint system is invariant:
reaction time is human
bat speed has limits
pitch travel time is bounded
Even as:
velocity increases
spin rates change
training evolves
The underlying physics remain:
the pitcher compresses time and space; the batter must resolve it
9. The deeper model
This allows restatement of the entire framework:
Hitting is a reactive system operating under externally imposed constraint fields.
The pitcher defines the constraints.
The batter’s performance is the stability of their response.
10. Final synthesis
The greatest hitters are not those who maximize output in free conditions.
They are those who maintain stable, high-quality reactions under maximum constraint.
That is why the list is so small.
That is why it reproduces across eras.
And that is why the pitcher is not just an opponent—
he is the enforcer of the physics that define the limits of hitting itself.