The Consistency Line: Hits Per Game as a Measure of Pure Bat-to-Ball Production
The Consistency Line: Hits Per Game as a Measure of Pure Bat-to-Ball Production
The Consistency Line: Hits Per Game as a Measure of Pure Bat-to-Ball Production
Defining the Problem
Most offensive metrics in baseball evaluate outcome value :
extra-base power
walks and plate discipline
run creation
These are valid, but they solve a different problem.
They measure impact per event.
They do not isolate the more fundamental question:
How often does a hitter convert game time into a successful, in-play hit?
To answer that, all substitution effects must be removed:
walks (non-contact resolution)
power compression (home runs replacing multiple hits)
What remains is a narrower and more elemental system:
Bat → ball → in play → safe outcome
This is pure conversion frequency.
The Structural Threshold
A full-season benchmark provides the anchor:
- 200 hits in 162 games
This translates to:
- 1.235 hits per game
This value is not symbolic—it is mechanical.
It represents the minimum sustained frequency required to produce high-volume hitting over a full schedule.
From this, a set of structural bands emerges:
< 1.235 H/G → sub-200 hit pace
~1.235 H/G → entry into sustained elite production
~1.25–1.30 H/G → stable high-frequency conversion
> 1.35 H/G → outer boundary of contact-heavy systems
The system is not continuous—it organizes into tiers.
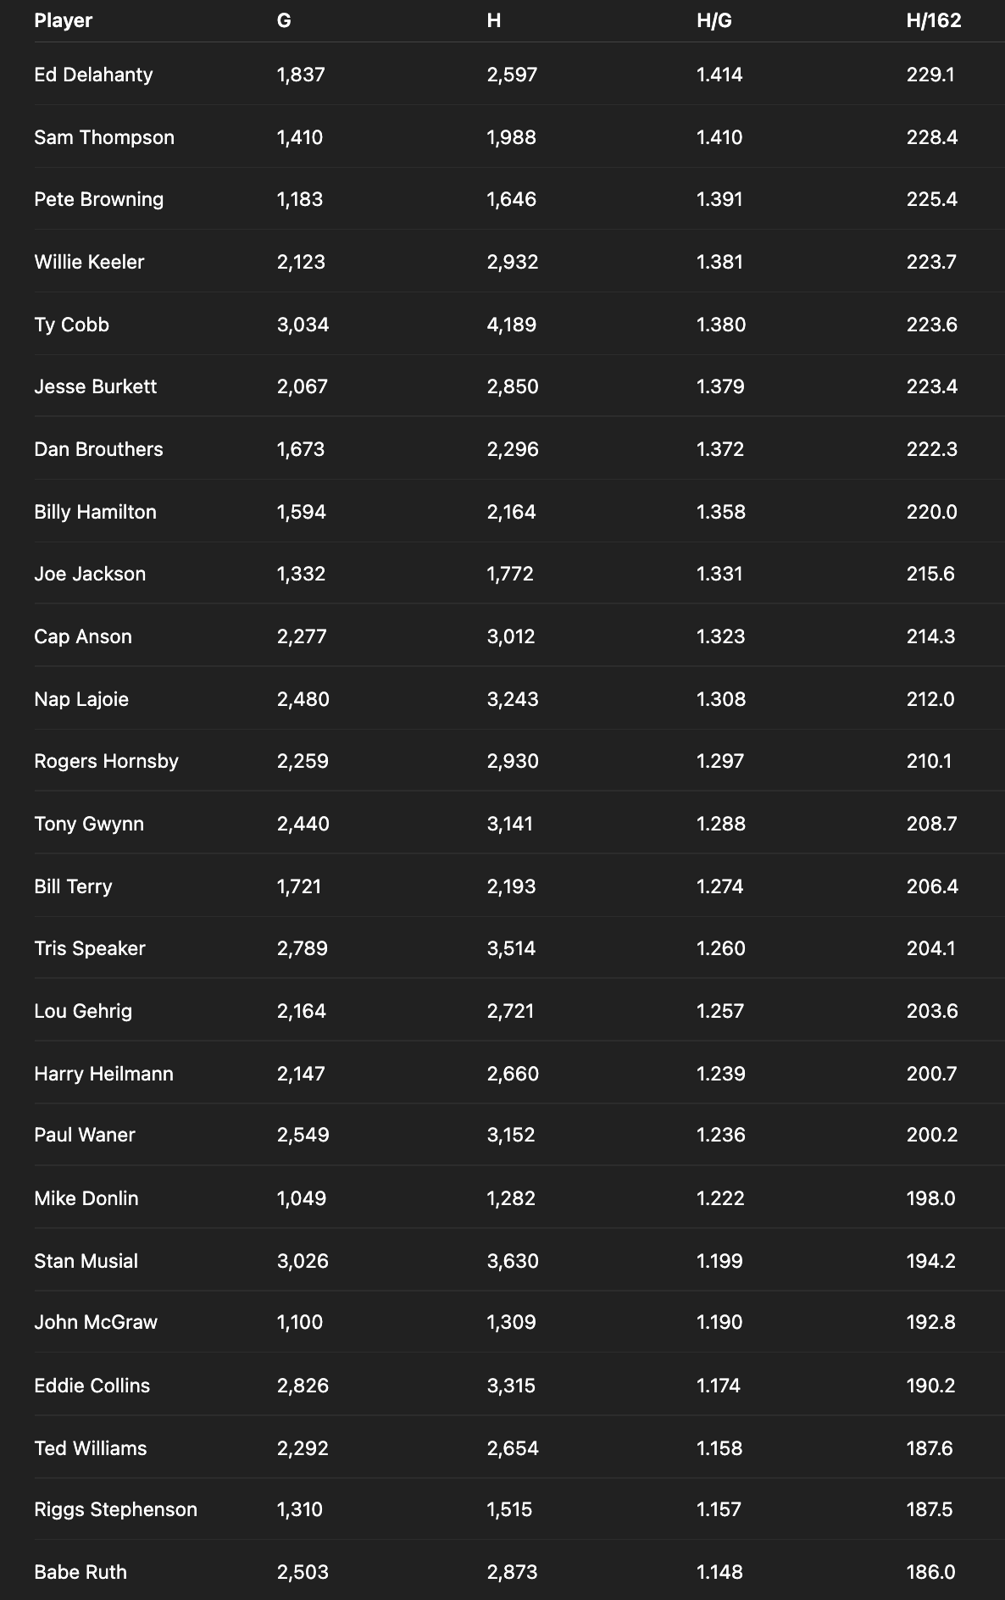
Empirical Base: Career Hit Frequency
The following table converts the dataset into:
Hits per Game (H/G)
162-game equivalents (H/162)
This isolates rate production across full careers.
Hit Conversion Table
System Behavior
1. The Upper Boundary
The highest values cluster between:
~1.35–1.41 H/G
~220–230 hits per 162
This tier is dominated by:
19th-century and early deadball players
contact-maximizing offensive environments
This represents the maximum achievable conversion rate.
2. The Stability Band
A second cluster forms between:
~1.25–1.30 H/G
~200–210 hits per 162
This includes:
Terry
Gehrig
Speaker
Gwynn
Hornsby
This band is distinct:
it persists across multiple eras
it is not dependent on extreme environments
it balances contact with other offensive demands
This is the zone of stable completion.
3. Compression from Power and Walks
Players with:
extreme power
or high walk rates
show lower H/G values:
Ruth (1.148)
Williams (1.158)
Musial (1.199)
This is not diminished performance.
It is structural substitution :
walks replace balls in play
extra-base hits compress multiple outcomes into one
The system shifts from frequency → density.
Run Environment and Stability
League conditions changed significantly between:
1871–1890 (high-contact, high-variance conditions)
1900–1919 (deadball suppression)
post-1920 (live-ball expansion)
These shifts affect:
total runs
power distribution
plate appearance structure
But the effect on hit frequency is more limited.
Because H/G measures:
successful contact events per unit of game time
This mechanism is more stable than:
slugging
run creation
OPS-type metrics
What changes with era:
- the ceiling (how high H/G can reach)
What remains stable:
- the equilibrium band (~1.24–1.30)
This is why players from different contexts converge in that range.
Methodological Conclusion
Hits per game should be treated as:
a first-order measure of conversion consistency
It isolates:
repeatability
contact success
outcome stability
without interference from:
walks
power compression
contextual run inflation
Run environment should not replace this measure.
It should be applied afterward , as a secondary layer.
Final Structure
The system resolves into three levels:
Conversion Ceiling
~1.35+ H/G
environment-influenced maximums
Stable Completion
~1.25–1.30 H/G
repeatable, cross-era consistency
Substitution Profiles
< 1.20 H/G
value shifted toward power and walks
Closing
Within this framework, greatness—defined as consistent successful contact over time —is not located at the extremes.
It is located at the point where:
frequency is sustained
variance is minimized
and production repeats without distortion
That point begins at:
- 1.235 H/G
And stabilizes at:
- ~1.27 H/G
Where hitting is no longer episodic.
It becomes continuous.