The Elite Hitters — What the Numbers Actually Show
The Elite Hitters — What the Numbers Actually Show
The Elite Hitters — What the Numbers Actually Show
This is a breakdown of great hitters using only:
Batting Average (AVG) → how often they get hits
On-Base (OBP) → how often they reach base
Slugging (SLG) → how much power they produce
We also separate two key differences:
OBP – AVG → plate discipline (walks, approach)
SLG – AVG → power (extra bases)
Then we compare that to:
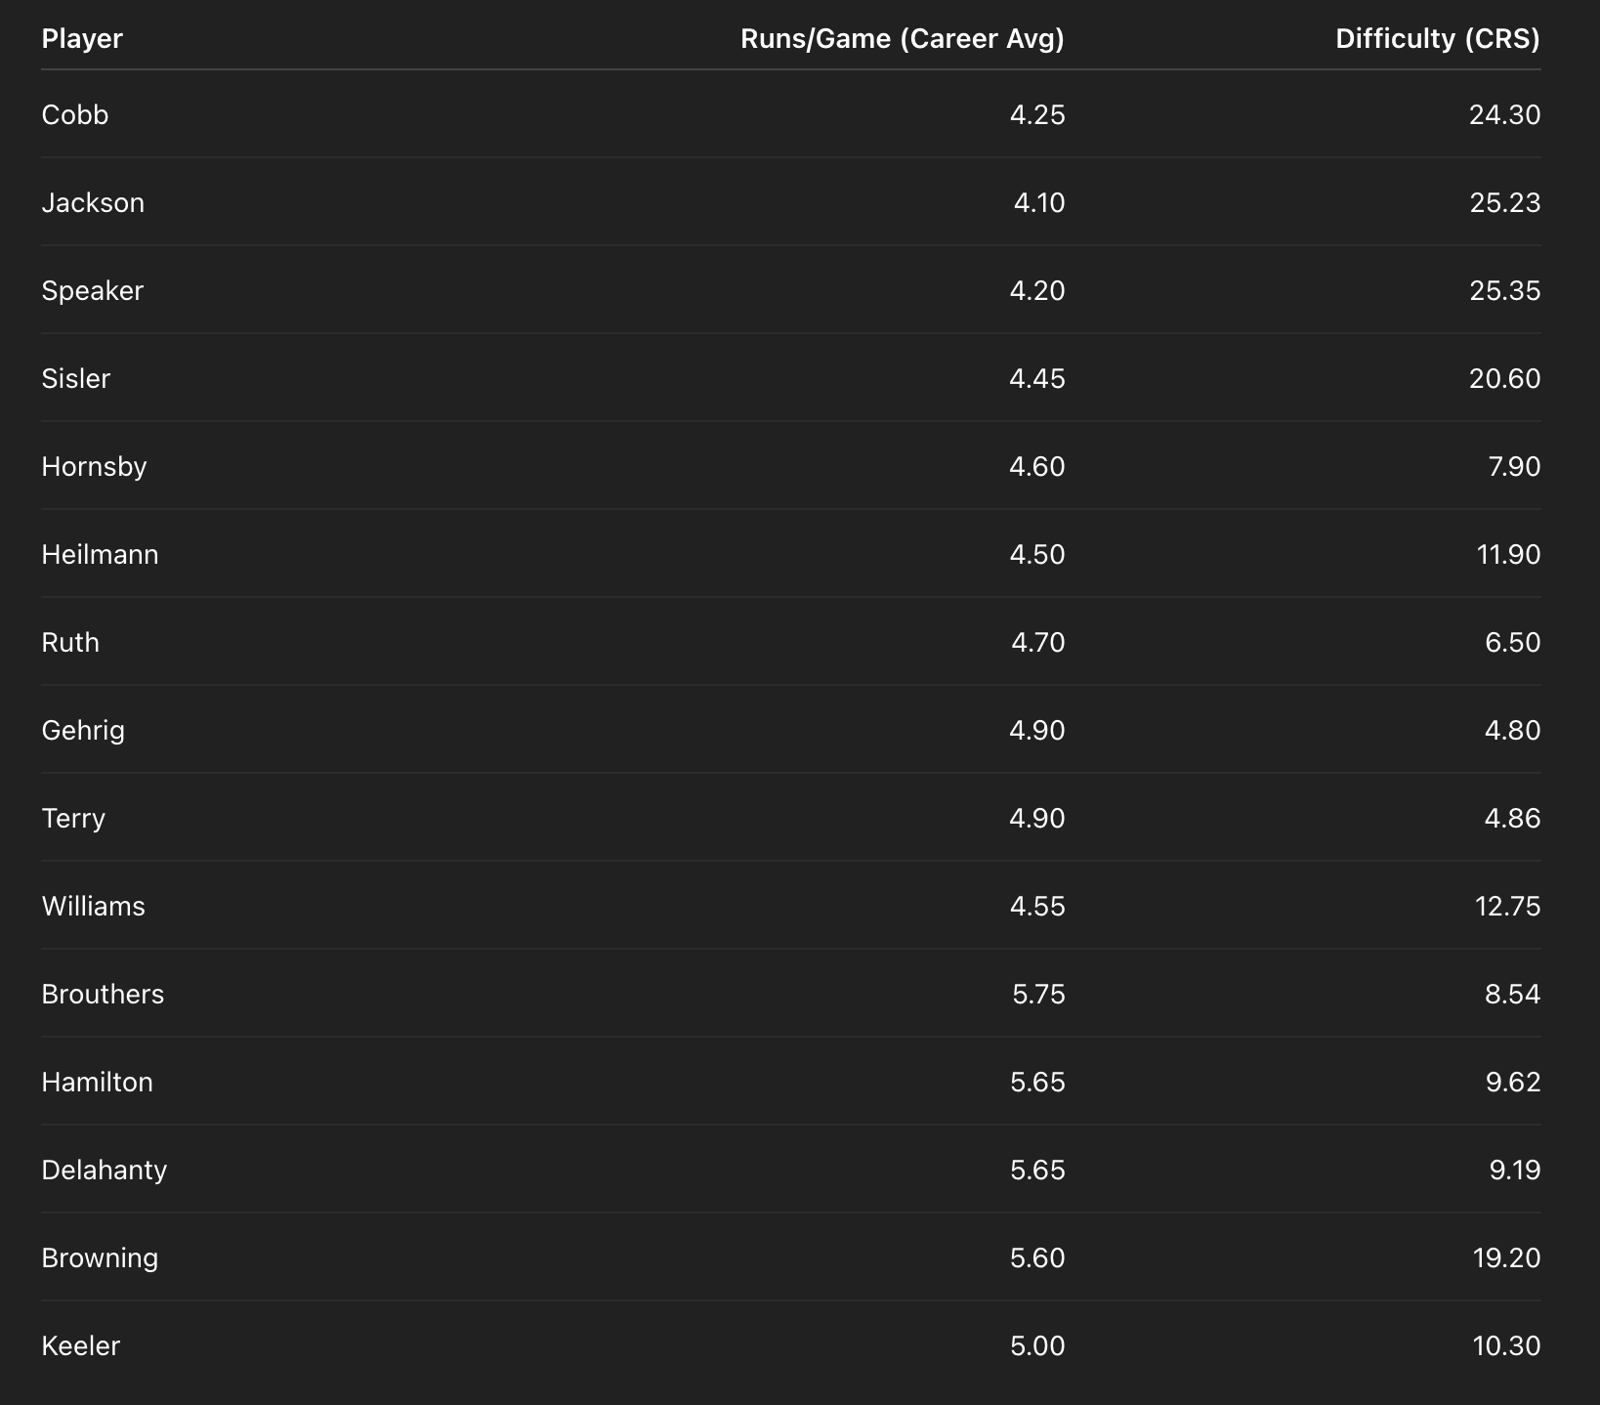
Runs per game (R/G) → how easy offense was in their career
CRS → how structurally difficult their environment was
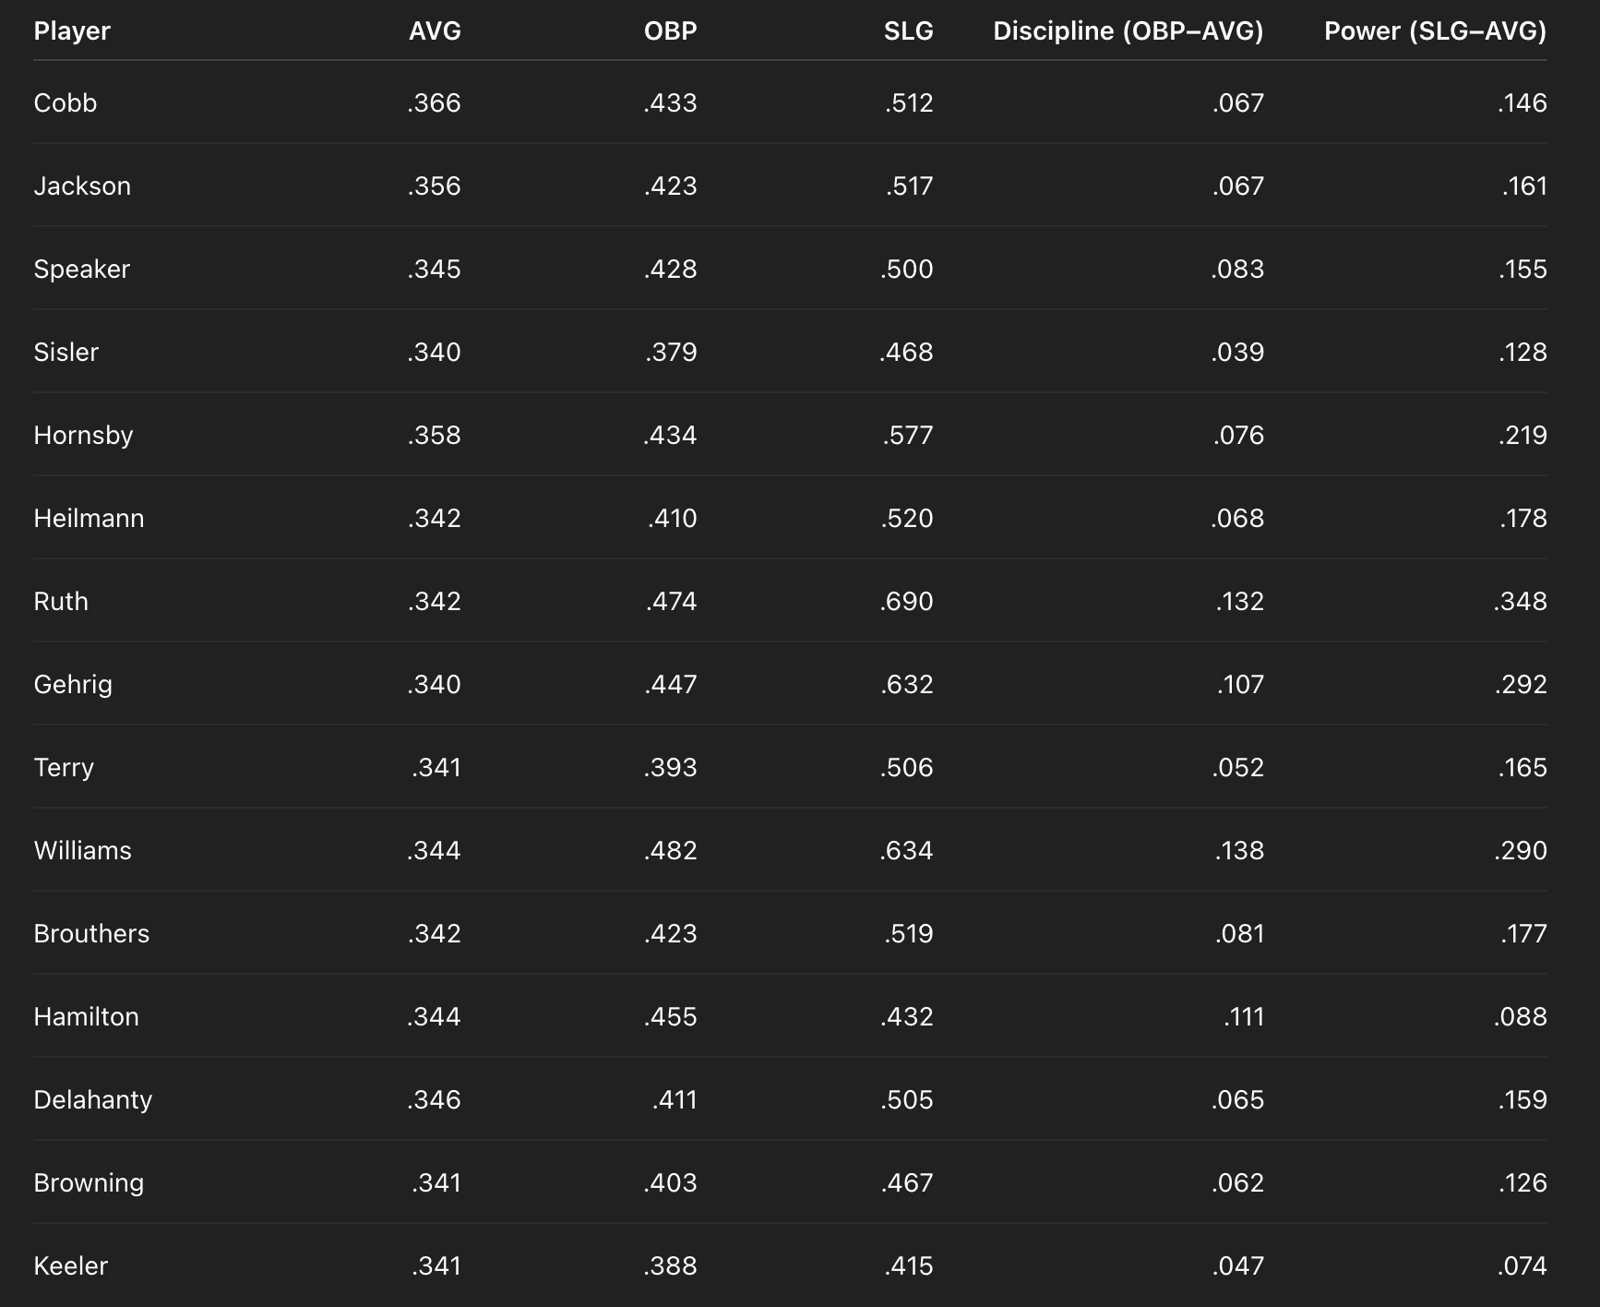
1. Core Rate Breakdown (Clean Table)
2. The Environment They Played In
3. What the Numbers Say (Simple Patterns)
A. Batting Average (Hitting the Ball)
Highest averages:
Cobb (.366)
Hornsby (.358)
Jackson (.356)
These happen even in low-scoring environments (~4.0–4.3 R/G)
Conclusion:
Getting hits does NOT depend on how high scoring the league is.
B. Plate Discipline (Walks / Approach)
Largest gaps (OBP–AVG):
Williams (.138)
Ruth (.132)
Hamilton (.111)
Gehrig (.107)
Smallest:
Sisler (.039)
Keeler (.047)
Terry (.052)
Bigger discipline gaps show up in higher-scoring environments
Conclusion:
Plate discipline increases as offense becomes easier.
C. Power (Extra Bases)
Largest power gaps (SLG–AVG):
Ruth (.348)
Gehrig (.292)
Williams (.290)
Hornsby (.219)
Smallest:
Keeler (.074)
Hamilton (.088)
Sisler (.128)
All huge power numbers happen when:
- Runs/game ≥ ~4.5
Conclusion:
Power is the MOST environment-dependent skill.
4. Clean Groupings (Based on Numbers Only)
Group 1 — Lowest Run Environments (Hardest Conditions)
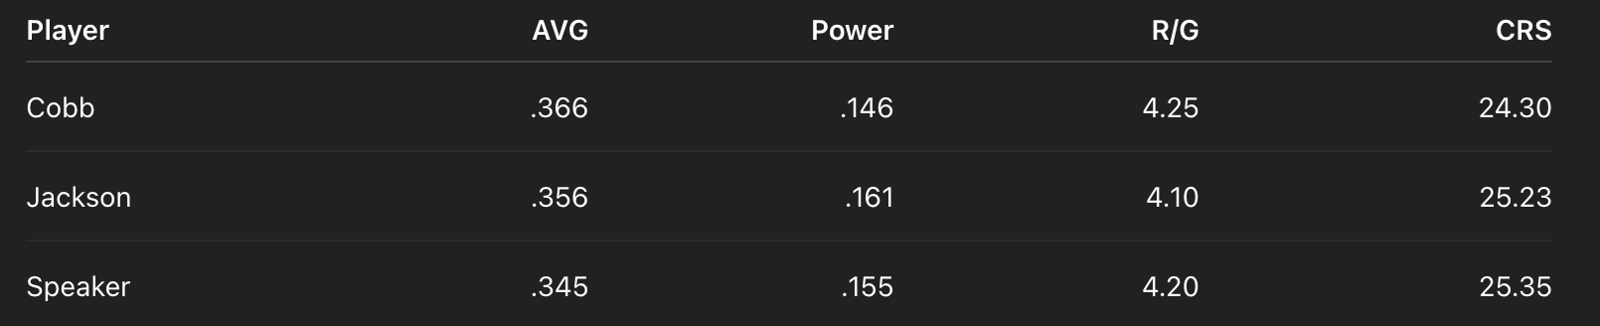
High averages
Moderate power
Highest difficulty
Pattern:
Power is limited
Production comes from hitting consistency
Group 2 — High Power Expansion (Easier Environments)
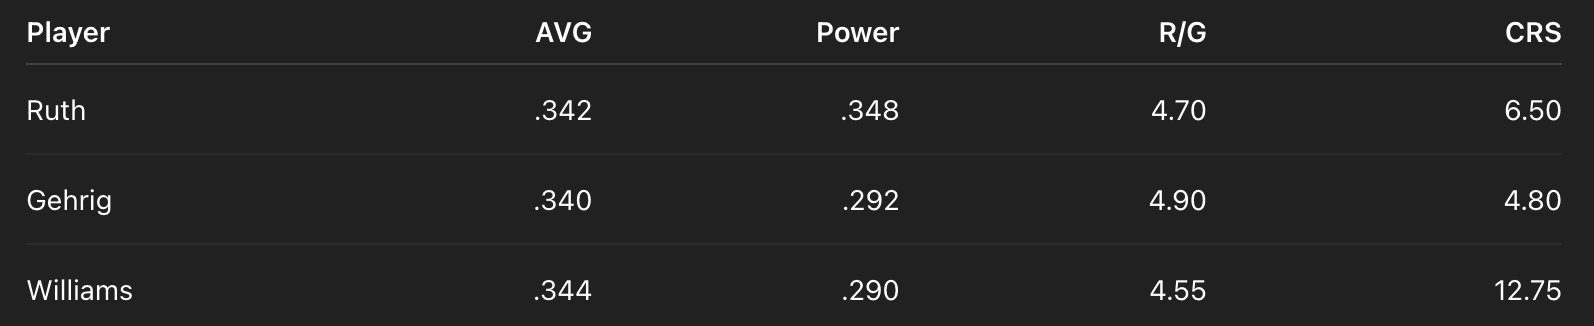
Massive power
High OBP
Lower difficulty
Pattern:
Power expands dramatically
Overall production increases
Group 3 — Balanced Profiles
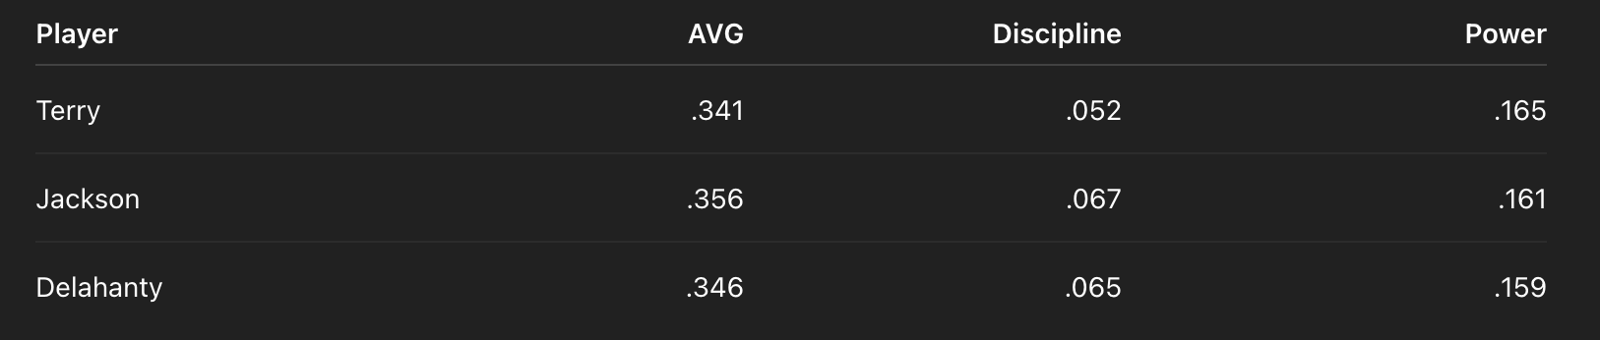
No extreme values
All categories moderately high
Pattern:
- Even distribution across all skills
Group 4 — High-Run Environments (19th Century)
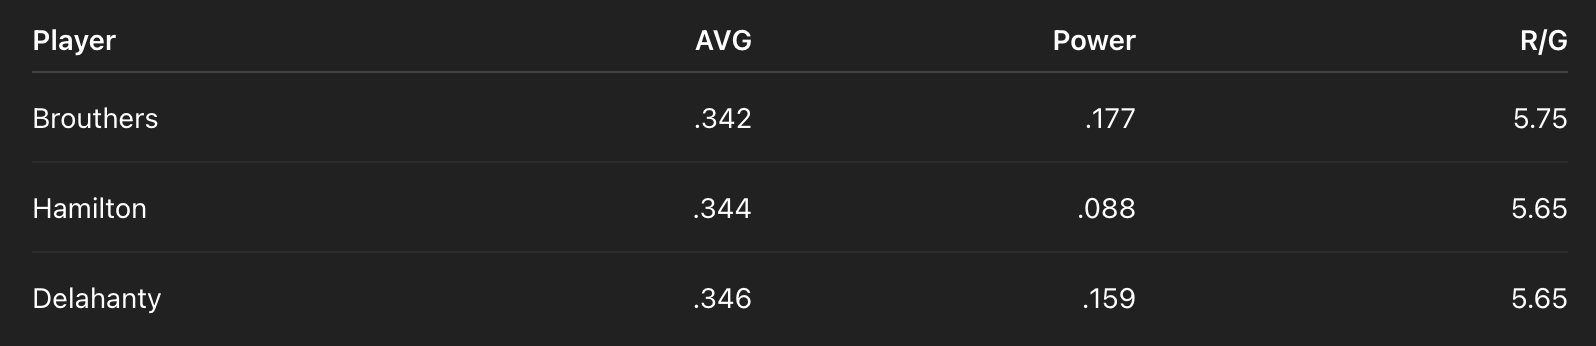
High scoring environments
Moderate to low power
Lower difficulty
Pattern:
Easier offensive conditions
No extreme power expansion
5. The Three Biggest Takeaways
1. Power depends on environment
No elite power in low-scoring systems
All extreme power happens in higher-scoring eras (particularly live-ball)
2. Batting average does NOT depend on environment
- Highest averages occur even in the hardest eras
3. Difficulty splits the group cleanly
Hardest conditions:
Cobb / Jackson / Speaker
Low runs + high resistance
Easiest conditions:
Gehrig / Terry / Ruth
High runs + low resistance
Final Line
When you strip everything down to numbers:
Hitting is constrained differently across environments —
Average remains stable
Discipline scales with opportunity
Power expands only when the system allows it