The Equilibrium of Hitting: Why 1.27 Hits Per Game Defines the System
The Equilibrium of Hitting: Why 1.27 Hits Per Game Defines the System
The Equilibrium of Hitting: Why 1.27 Hits Per Game Defines the System
Baseball analysis usually begins with outcomes.
Batting average.
Slugging percentage.
Total value.
But these are partial descriptions. They isolate performance along single axes, while the act of hitting itself is constrained by something deeper:
the need to sustain production continuously over time
To understand that constraint, hitting must be treated not as a collection of stats, but as a system.
Constraining the System
To isolate real structure, two conditions are required:
Career scale → at least 7,000 plate appearances
Sustained force → slugging percentage of .500 or higher
This removes:
short careers
partial samples
and hitters who never carried meaningful power over time
What remains is a stable population of hitters who:
produced with force, across full careers
Within this group, meaningful comparison becomes possible.
The Three Forces of Hitting
Every hitter operates under three competing demands:
Conversion → batting average
Force → slugging percentage
Frequency → hits per game
These are not independent skills.
They are constrained by:
reaction time
swing mechanics
pitch velocity and movement
and decision limits
As one increases, another tends to decline.
The problem of hitting is not maximizing one dimension.
It is:
maintaining all three simultaneously without collapse
A Mathematical Representation
Each dimension can be normalized to a structural baseline:
AVG → .340
SLG → .500
H/G → 1.27
Each player is expressed relative to those thresholds and combined using a geometric mean:
Complete Hitter Score (CHS)
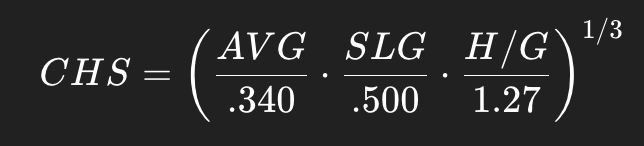
The choice of the geometric mean is critical.
It does not allow dominance by a single axis.
If any dimension weakens, the entire score declines.
It measures not how great a hitter is in isolation—but:
how well the system holds together
Why Hits Per Game Is the Critical Constraint
Batting average and slugging percentage are rate efficiencies per at-bat.
Hits per game is different.
It measures:
realized production across time
It answers a fundamentally different question:
Does the hitter produce often enough, game after game, to sustain both efficiency and force?
This is where the system reveals its boundary.
The Emergence of 1.27
Within the filtered population (≥ .500 SLG, ≥ 7,000 PA), a clear structure appears.
High-frequency hitters:
Ed Delahanty → 1.414 H/G
Ty Cobb → 1.381
Dan Brouthers → 1.372
Integrated equilibrium:
Rogers Hornsby → 1.297
Bill Terry → 1.274
Immediately below:
Lou Gehrig → 1.257
Harry Heilmann → 1.239
This is not a smooth gradient.
It is a boundary.
At approximately 1.27 hits per game , the system changes behavior.
What Breaks Below the Line
Below this threshold, hitters can no longer sustain:
elite average
meaningful power
continuous hit production
simultaneously.
Something must give.
Production begins to reorganize through compensation:
Gehrig sacrifices a small amount of frequency for greater power density
Ruth and Williams push further, trading frequency for extreme force and selectivity
Their output remains enormous.
But it is achieved through reallocation , not balance.
The Meaning of 1.27
This leads to a precise formulation:
1.27 hits per game is the minimum event rate at which a hitter can sustain both elite average and power across a full career without requiring compensatory tradeoffs.
Above it:
the system remains internally stable
all three forces are sustained simultaneously
Below it:
frequency becomes insufficient
production must be redistributed into other dimensions
The Boundary: Bill Terry
Bill Terry sits exactly at this threshold:
- 1.274 H/G
He does not dominate any single category.
But he does not fail any category.
He represents:
the minimum viable configuration of the complete hitter
Below him, the system does not disappear—but it changes form.
Why This Boundary Matters
This is not an arbitrary cutoff.
It is:
empirically observed → it emerges from clustering
structurally meaningful → it marks a shift in how production is generated
mathematically necessary → it preserves both the equilibrium group and its boundary
Lower the threshold, and incomplete systems are misclassified as complete.
Raise it, and true equilibrium cases disappear.
Conclusion
Great hitters can dominate in many ways:
Through power.
Through efficiency.
Through selectivity.
But within the constraints of the game, only a few achieve:
continuous production, meaningful force, and sustained frequency—simultaneously
That space is narrow.
It is stable.
And it is defined by a single, non-arbitrary condition:
the ability to produce hits at a rate of approximately 1.27 per game, over the length of a career
Below that, greatness persists.
But the system no longer holds together.