The Expansion of Offensive Geometry: Ruth, Hornsby, and the Structural Break in Early 20th-Century Baseball
The Expansion of Offensive Geometry: Ruth, Hornsby, and the Structural Break in Early 20th-Century Baseball
The Expansion of Offensive Geometry: Ruth, Hornsby, and the Structural Break in Early 20th-Century Baseball
Abstract
Between 1901 and 1919, Major League Baseball operated within a compressed offensive distribution commonly referred to as the Deadball Era. Run scoring was lower, home runs were rare, and slugging percentages were tightly clustered. While elite hitters existed, the upper statistical tail of offensive performance remained structurally constrained.
Beginning in 1920, that geometry changed abruptly. Two players—Babe Ruth and Rogers Hornsby —did not merely outperform their peers; they expanded the variance of league offense and redefined the upper boundary of sustainable dominance. This paper examines how and why that structural break occurred.
I. The Deadball Distribution (1901–1919)
Deadball baseball was characterized by:
Low league slugging percentages (.330–.370 typical range)
Minimal home run output (often < 100 league-wide annually before 1910)
Ball composition that suppressed carry
Foul balls not counted as strikes before 1901 in NL and 1903 in AL
Limited roster specialization
Strategic emphasis on contact, bunting, and base running
Because OPS+ is indexed to league average (100 = average), it does not impose a cap on greatness. However, the shape of the distribution matters.
When league SLG is low and home runs are scarce:
Absolute separation via power is structurally limited.
Most elite hitters cluster in the 150–170 OPS+ range.
Sustained 180+ seasons are rare.
For example:
Ty Cobb — Career OPS+ 168
Honus Wagner — Career OPS+ 151
Nap Lajoie — Career OPS+ 150
Dominant players existed—but the upper tail was compressed.
The system rewarded skill.
It did not yet reward exponential power output.
II. The Structural Break of 1920
In 1920, multiple forces converged:
Introduction of the livelier cork-centered ball (standardized after 1919).
Increased replacement of scuffed or damaged balls during games.
Outlawing of the spitball for most pitchers.
War-driven roster churn (WWI).
Ballpark design beginning to accommodate higher flight trajectories.
Strategic shift toward power hitting.
The league environment changed. But environment alone does not explain what followed.
Two hitters exploited—and accelerated—the change.
III. Ruth: Variance Explosion
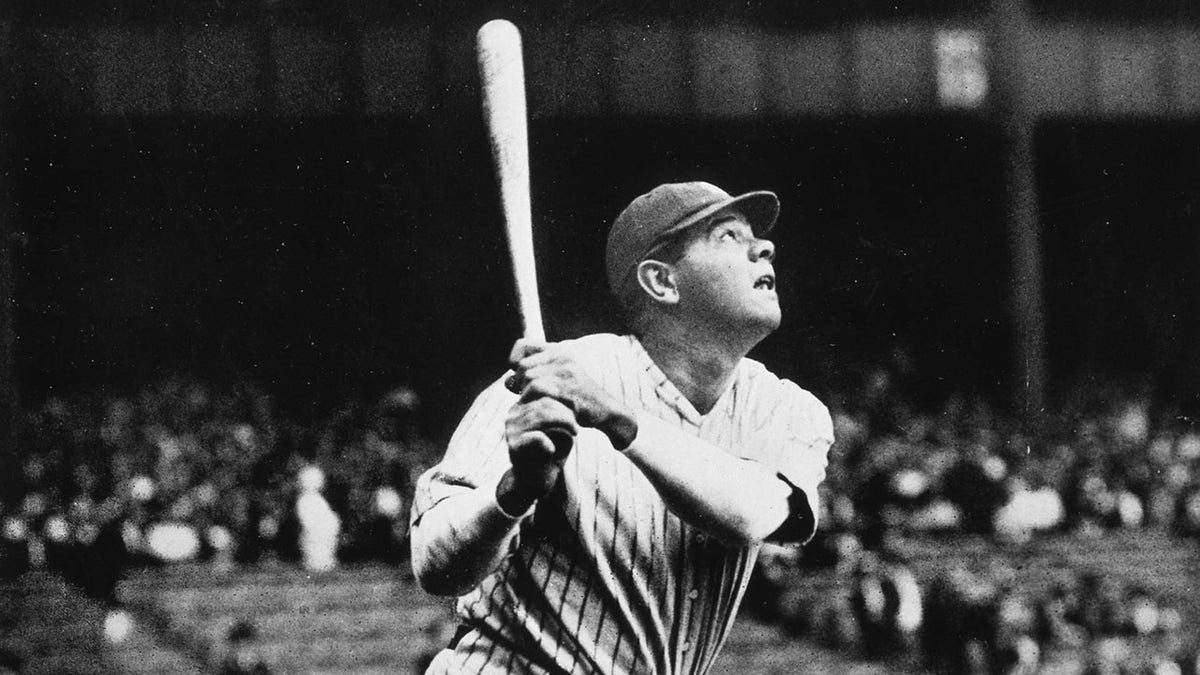
Babe Ruth career OPS+: 206
Selected peak seasons:
1920 — OPS+ 255
1921 — OPS+ 239
1923 — OPS+ 239
1927 — OPS+ 225
Ruth’s transformation from pitcher to full-time hitter coincided with the live-ball shift. But his separation from the league was historically unprecedented.
Before 1920, no modern player sustained a career OPS+ above 180 across full-time play.
Ruth didn’t merely exceed average—he created statistical distance that had not previously existed.
He:
Hit more home runs than entire teams.
Increased league slugging by forcing pitchers to alter approach.
Expanded the upper bound of possible offensive dominance.
This is what is meant by “variance expansion.”
The right tail of the offensive distribution widened.
IV. Hornsby: The Co-Riser
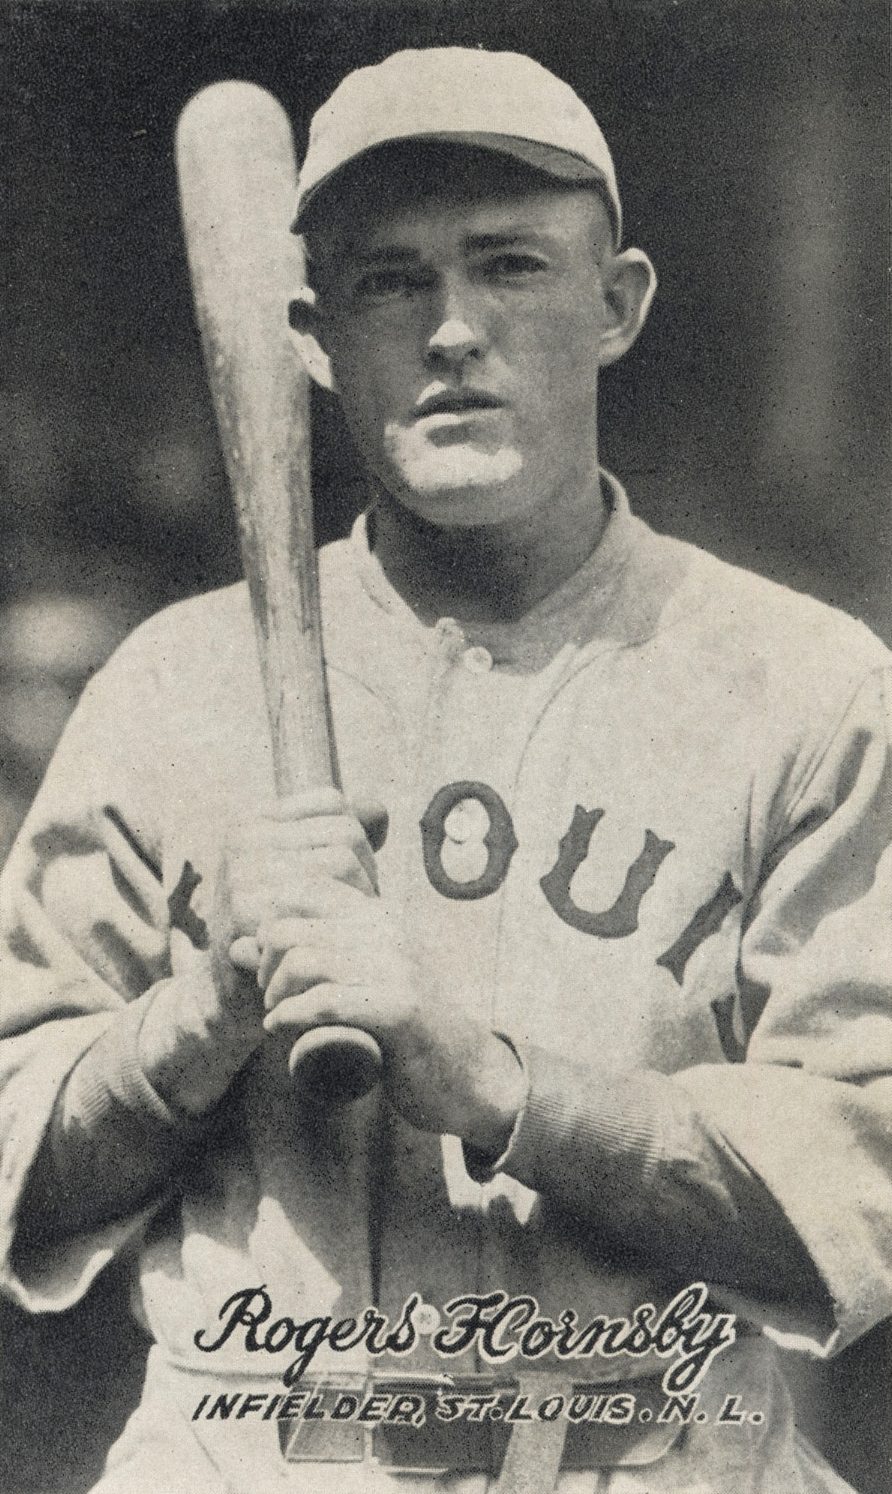
Rogers Hornsby career OPS+: 175
Peak stretch (1921–1925):
1921 — OPS+ 181
1922 — OPS+ 207
1923 — OPS+ 179
1924 — OPS+ 222
1925 — OPS+ 186
Hornsby was not a home run revolutionary like Ruth, but he was the most complete right-handed offensive engine of the era:
Extraordinary contact ability (.358 career BA)
Elite power (.577 career SLG)
Consistent separation from league average
If Ruth detonated the ceiling, Hornsby institutionalized the new geometry.
Together they demonstrate:
Sustained 200+ OPS+ seasons were now possible.
Elite power-contact hybrids could exist.
The league’s offensive tail was permanently widened.
V. What “Geometry” Means in This Context
By geometry, we refer to:
The distributional shape of OPS+ values.
The width of the upper tail.
The maximum sustainable distance from league mean.
Deadball geometry:
Tight clustering.
Upper tail around ~170–180.
Power scarcity.
Live-ball geometry post-1920:
Increased variance.
200+ seasons feasible.
Multiple elite power hitters per decade.
Ruth was the singular rupture.
Hornsby was the proof of new equilibrium.
VI. Did the Era “Limit” OPS+?
Not mechanically.
OPS+ scales relative to league average.
But era can influence:
Standard deviation of offensive output.
Run environment volatility.
Power availability.
Strategic ceiling.
Deadball conditions suppressed extreme power outcomes.
Live-ball conditions enabled separation through power.
Ruth exploited this more than anyone.
Hornsby validated that the expansion was not a fluke.
VII. Structural Conclusion
The Deadball Era produced elite hitters, but within a compressed distribution.
The 1920 live-ball shift widened offensive variance.
Babe Ruth created a statistical rupture in the upper tail.
Rogers Hornsby sustained elite separation within the new geometry.
Post-1920, 190–220 OPS+ seasons became structurally achievable.
In statistical terms:
Pre-1920 upper elite: ~160–175 OPS+
Post-1920 upper elite: ~175–220 OPS+
Ruth: persistent outlier above 200
This was not merely an individual dominance story.
It was a systemic expansion of offensive possibility.
The ceiling did not vanish.
It moved upward.
And it has never fully returned to Deadball compression.