The Geometry of Hitting: Mapping the Field of Symmetry Around .340 / .400 / .500
The Geometry of Hitting: Mapping the Field of Symmetry Around .340 / .400 / .500
The Geometry of Hitting: Mapping the Field of Symmetry Around .340 / .400 / .500
The Geometry of Hitting: Mapping the Field of Symmetry Around .340 / .400 / .500
Baseball history is usually written in the language of greatness.
Home runs. Totals. WAR. Accumulation.
But those are outcomes. They describe what happened , not how the act of hitting is structured.
If we strip all of that away—if we remove totals, remove context, remove era—and look only at the rate lines , something far more precise emerges:
Hitting is not a spectrum. It is a geometric field.
And at the center of that field sits a clean, almost architectural form:
.340 AVG / .400 OBP / .500 SLG
I. The Symmetry Line
Each component of this line corresponds to a fundamental demand of hitting:
.340 AVG → conversion
The ability to turn opportunities into hits at an elite rate.400 OBP → command
The ability to avoid outs and sustain presence.500 SLG → force
The ability to generate meaningful extra-base impact
Individually, these thresholds are familiar. Together, they form something different:
a closed system
There is no redundancy inside this line. No excess. No compensation.
You cannot fake .340 with walks
You cannot fake .400 without discipline
You cannot reach .500 without real damage
This is not “great hitting.”
This is complete hitting.
II. From List to Field
Once the symmetry point is defined, the problem changes.
We are no longer asking:
Who was the best?
We are asking:
How close does each hitter come to this shape?
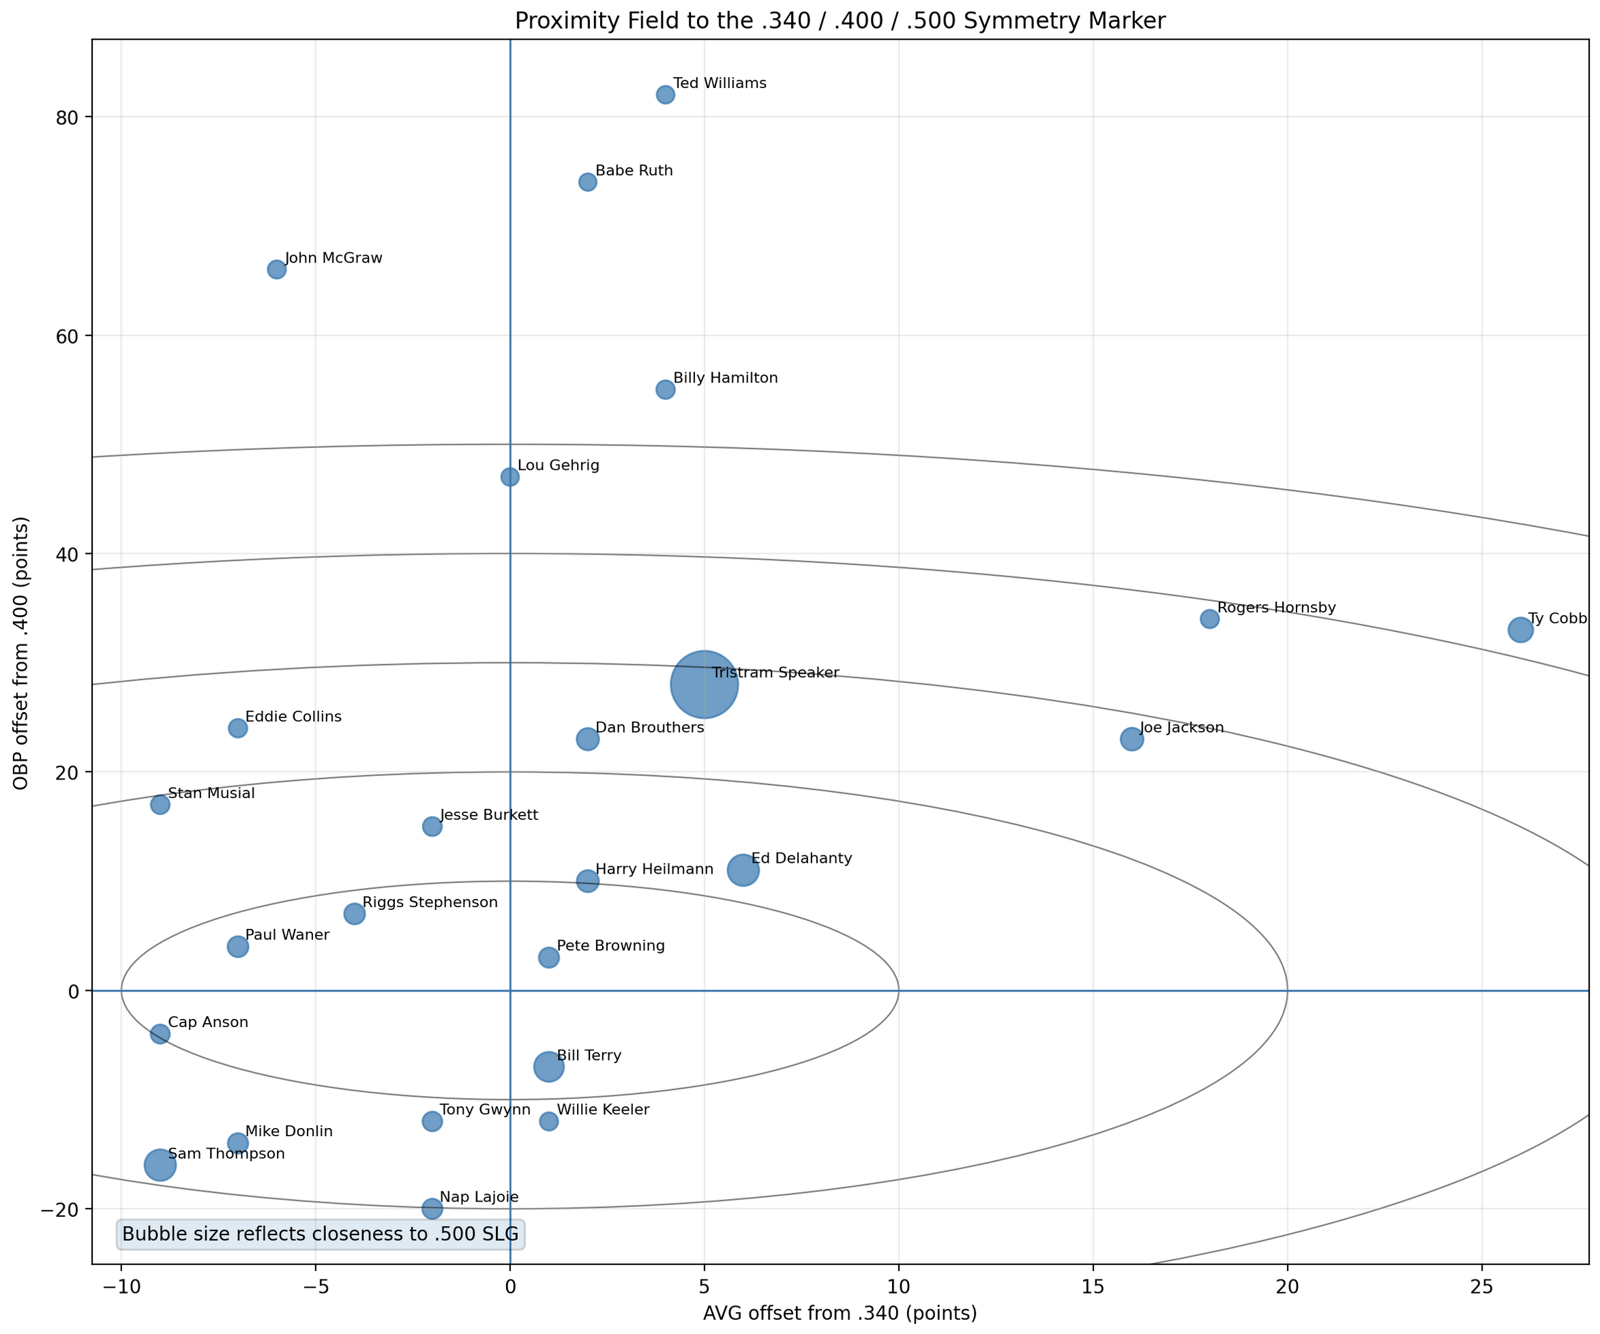
To answer that, we mapped every player as a point in three-dimensional space:
distance from .340 in AVG
distance from .400 in OBP
distance from .500 in SLG
Each hitter becomes a coordinate.
Each career becomes a position in a field.
What emerges is not a ranking—it is a topography.
III. The Center: Bill Terry
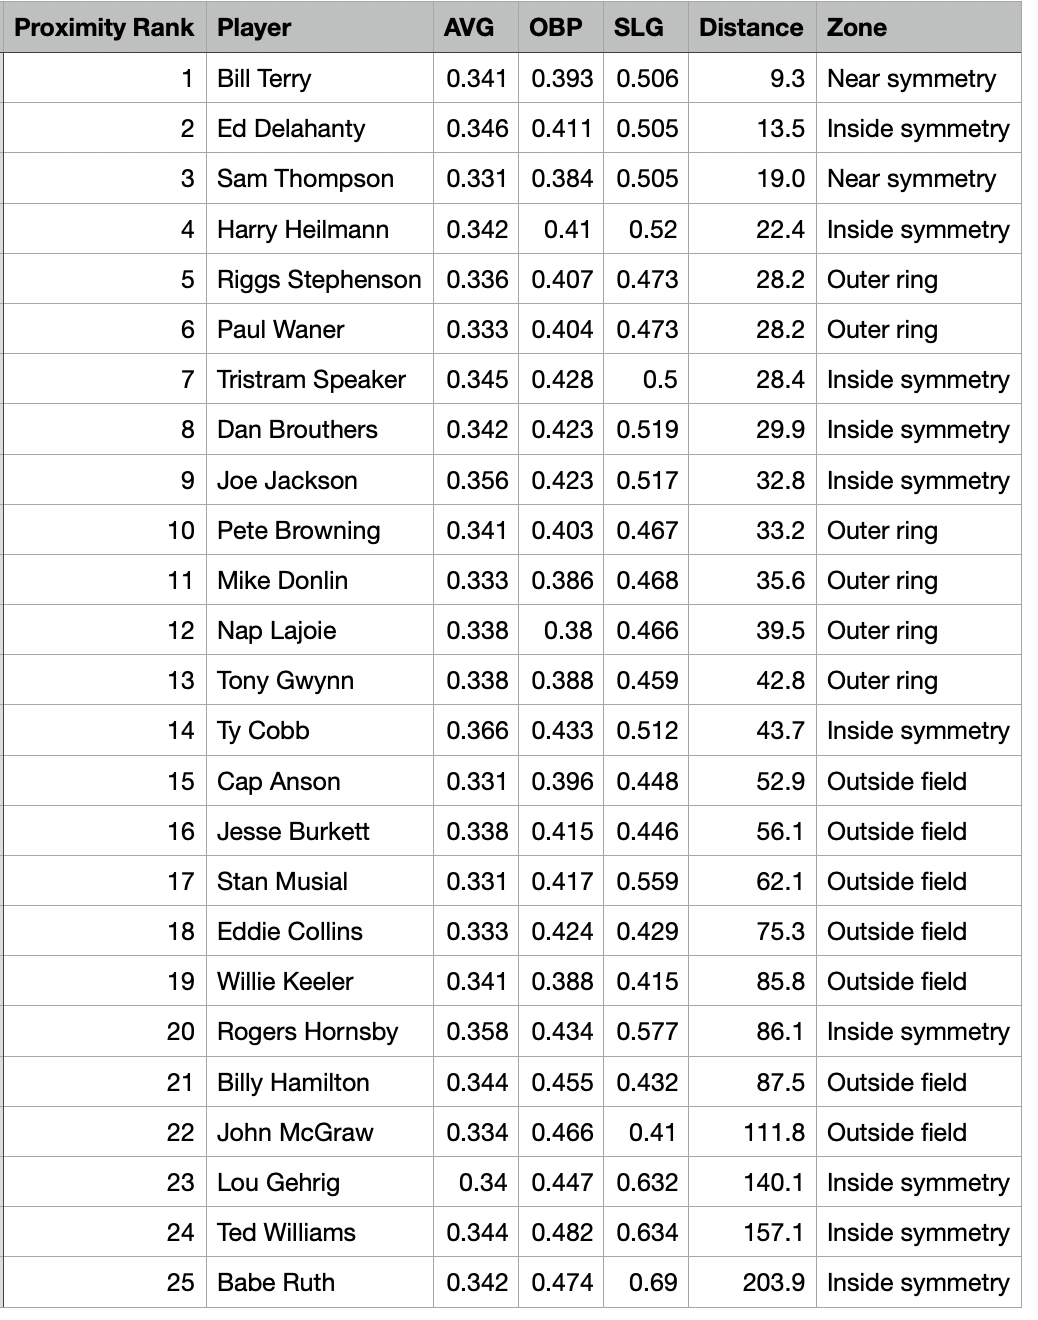
At the center of this field—closest to the symmetry line—is Bill Terry :
.341 AVG
.393 OBP
.506 SLG
He misses the symmetry line by the smallest possible margins:
OBP just under
SLG just over
AVG cleanly inside
Measured geometrically, his deviation is minimal.
But more importantly, his shape is intact.
There is no distortion in Terry’s line:
no inflated OBP
no excessive power
no compensating imbalance
He is not the greatest hitter in history.
He is the closest natural form to perfect proportional balance.
Terry defines the center of the field.
IV. The Near Field: Balanced Variants
Just outside the center sit players like:
Ed Delahanty (.346 / .411 / .505)
Harry Heilmann (.342 / .410 / .520)
Dan Brouthers (.342 / .423 / .519)
They clear the symmetry thresholds—or come very close—but their shapes begin to stretch:
Delahanty expands OBP slightly
Heilmann expands SLG
Brouthers expands both OBP and SLG
They are still complete hitters.
But they are no longer perfectly tight systems.
They are near the symmetry—but not centered within it.
V. The Outer Field: Specialists and Distortions
As we move further out, the field separates into recognizable archetypes:
Conversion Dominance
Ty Cobb
Joe Jackson
High AVG, but the system leans toward contact.
OBP Constructs
McGraw
Hamilton
Collins
Command of outs dominates; force recedes.
Low-Force Efficiency
Burkett
Gwynn
Waner
Beautiful, clean lines—but SLG falls below the threshold.
Each of these is a solution —but not a complete solution.
They solve parts of the system, not the whole.
VI. The Paradox of Greatness: Ruth and Williams
Then there are the outliers:
Babe Ruth (.342 / .474 / .690)
Ted Williams (.344 / .482 / .634)
In the field, they appear far from the center.
Not because they are worse—but because they break the geometry.
Their lines overshoot the symmetry:
OBP far beyond necessity
SLG far beyond equilibrium
They do not sit within the system.
They exceed it.
This distinction is crucial:
Terry is closest to the ideal form
Ruth and Williams transcend the form entirely
The field measures symmetry , not supremacy.
VII. What the Field Reveals
Mapping hitters this way leads to a fundamental realization:
1. The space of complete hitting is extremely small
Once you require:
elite conversion
elite command
real force
…the population collapses to a handful of players.
2. Balance is rarer than dominance
It is easier to:
hit for extreme power
or maintain extreme average
than it is to sustain all three forces in proportion.
3. The symmetry line is real
Not because we declared it—but because:
players cluster around it
Terry nearly embodies it
even the greatest hitters either approach it or break away from it
It behaves like a natural boundary in the system.
VIII. Final Insight
What began as a simple threshold—
.340 / .400 / .500
—turns out to define something deeper:
the point at which hitting becomes structurally complete
And once that point is established, everything else falls into place:
Terry becomes the center
Delahanty and Heilmann form the near field
Cobb and Gwynn resolve into partial systems
Ruth and Williams explode beyond the structure entirely
Baseball history, seen this way, is no longer a list of achievements.
It is a map.
And at its center is not the most famous player,
not the most powerful,
not the most celebrated—
but the one whose line is closest to perfect proportion.
Bill Terry, at the edge of symmetry, defining the shape of the possible.