The Hidden Ceiling of Hitting: Why Dave Orr Appears as a Structural Outlier
The Hidden Ceiling of Hitting: Why Dave Orr Appears as a Structural Outlier
The Hidden Ceiling of Hitting: Why Dave Orr Appears as a Structural Outlier
When hitters across baseball history are ranked by hits per game , a striking pattern appears. The greatest hitters in the history of the sport—across different eras, ball constructions, pitching styles, and offensive environments—cluster within an extremely narrow band of production. The distribution suggests that baseball itself imposes a structural ceiling on how frequently even the best hitters can generate base hits within the rhythm of the game.
The Top Ten Hit Producers by Hits per Game
When the historical leaders are ranked by hits per game, the top of the distribution looks like this:
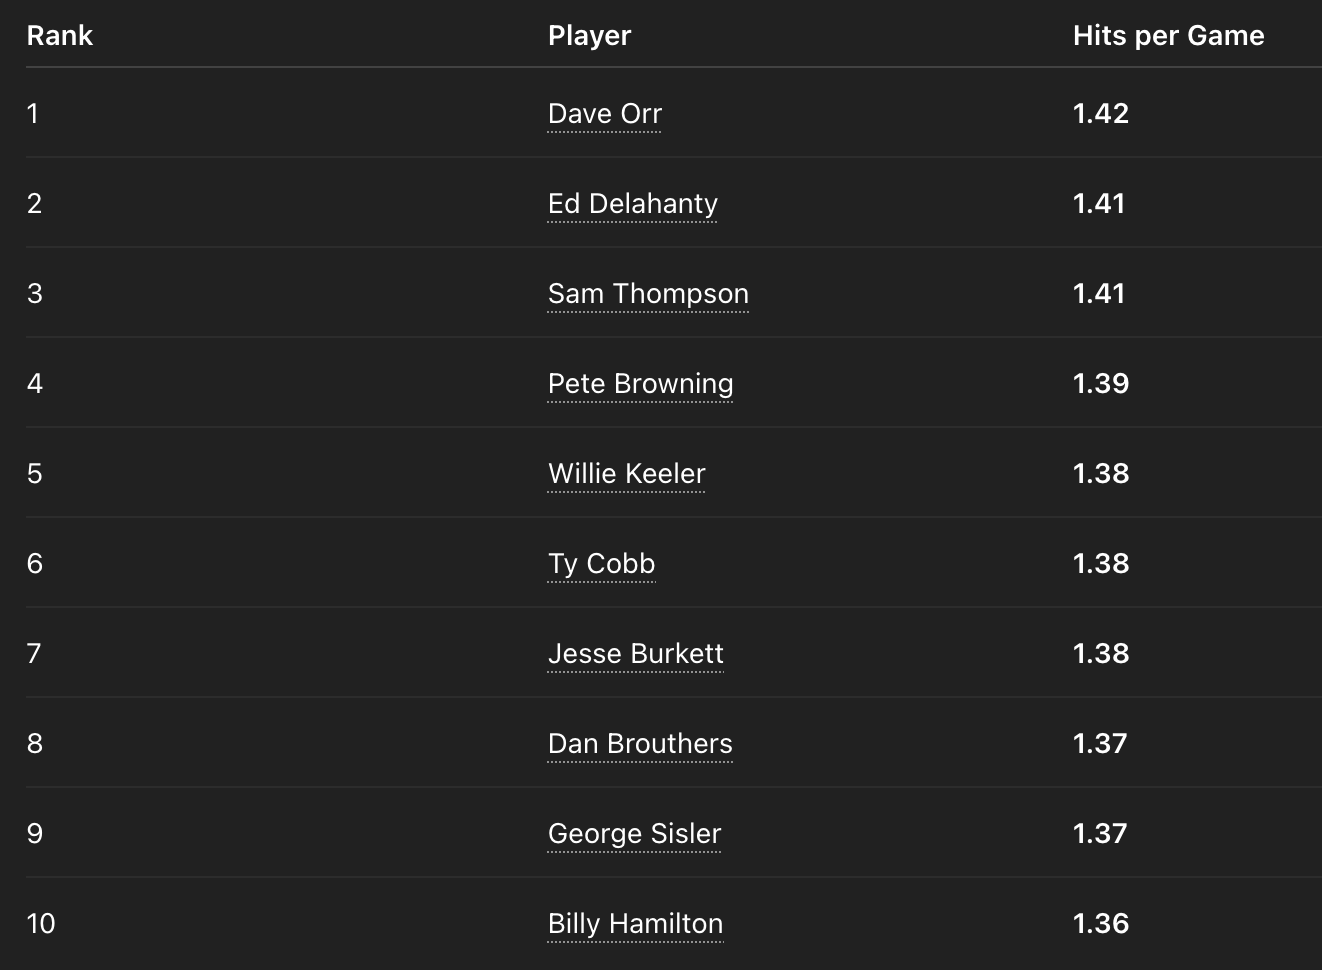
What immediately stands out is not the identity of the players—many are well-known stars of the 19th century and Deadball era—but the tight compression of the numbers themselves.
From #2 through #10 the entire elite group falls between 1.36 and 1.41 hits per game.
That is a total spread of 0.05 hits per game.
How Small That Range Actually Is
Because baseball seasons contain roughly 154–162 games, even small differences in hits per game translate into modest differences in real production.
A gap of 0.05 hits per game equals:
[
0.05 \times 154 \approx 7.7
]
In other words, the difference between many of the greatest hitters in baseball history amounts to about eight hits per season.
The structure of the sport compresses separation among elite contact hitters. Even extraordinary players are constrained by the rhythm and architecture of the game itself:
limited plate appearances per game
outs created by teammates
pitcher quality
defensive positioning
randomness of balls in play
Because of these constraints, sustained hit production appears to stabilize near a natural ceiling of roughly 1.35–1.38 hits per game.
This is why so many of the game’s great hitters—from different eras—converge toward nearly identical numbers.
The Structural Outlier
Within that context, one player stands out.

At first glance the difference between 1.42 and 1.41 seems trivial—just 0.01 hits per game. Over a season that equates to roughly 1.5 hits.
But the real comparison is not between Orr and the next decimal point. It is between Orr and the historical ceiling where most elite hitters cluster , which lies around 1.36–1.38.
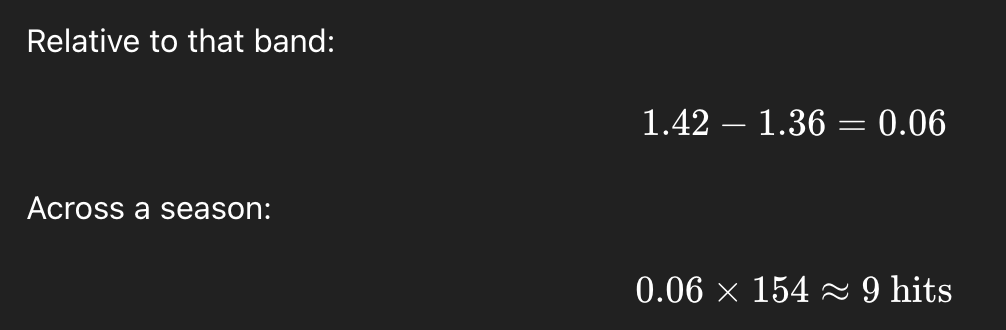
Across a thousand-game career, that represents roughly 60 additional hits relative to the elite historical cluster.
That separation is meaningful precisely because hits per game is already a compressed statistic. There is very little room for separation at the top of the distribution.
Why Orr Appears Above the Band
There is also a historical explanation for why Orr sits above the rest of the distribution.
Most hitters above 1.38 hits per game played before 1900. The game during this period operated under different competitive dynamics:
pitchers emphasized contact rather than strikeouts
pitching velocities were lower
strikeout rates were dramatically lower
defensive positioning was less sophisticated
the ball remained in play more frequently
These conditions produced more balls in play per plate appearance , increasing opportunities for hits.
As the game evolved in the early 20th century, pitching mechanics improved, strikeouts rose, and defensive positioning became more sophisticated. The ceiling for sustained hit production fell slightly and stabilized around the 1.35–1.38 range where most great hitters now reside.
What the Distribution Reveals
The most important insight from this table is not simply that one player produced slightly more hits than another.
It is that almost every great hitter converges into the same narrow production band.
Across different eras and conditions, the structure of baseball appears to compress elite hitters toward roughly 1.35 hits per game.
Within that framework, Dave Orr’s 1.42 hits per game stands out because it lies just beyond the normal equilibrium of the system.
The numerical gap may appear small, but in a metric where the entire elite spectrum spans only a few hundredths, even a slight deviation represents a meaningful structural difference.
What the numbers ultimately reveal is that baseball—through its rules, rhythms, and constraints—allows only limited separation among the greatest hitters. The remarkable fact is not how large the differences are, but how small they remain across the entire history of the sport.
Why Dave Orr’s Hits-per-Game Record Looks So Strange
When looking at the career line of Dave Orr, several features immediately stand out. His 1.42 hits per game places him above every other historically great hitter, slightly beyond the range where even elite contact hitters tend to cluster. At first glance this suggests a player who somehow broke the structural ceiling of the sport.
But when we examine the components of his statistical profile more closely, the explanation becomes clearer. Orr’s record is not the result of a single extraordinary trait. Instead it emerges from the interaction of several factors—some historical, some statistical—that together maximize the exact variables that drive hits per game.
1. The Strikeout Number Is Not Reliable
The first thing that catches the eye in Orr’s line is the extremely low strikeout total:
- 49 strikeouts in 3,411 plate appearances
That appears almost impossible by modern standards. However, this number cannot be interpreted literally.
Strikeouts were recorded in nineteenth-century baseball, but record keeping in the 1880s was not always perfectly consistent, particularly in the American Association where Orr spent most of his career.
While the listed total of 49 strikeouts may therefore be somewhat understated, the broader environment of the 1880s genuinely produced extremely low strikeout rates compared with modern baseball. Pitchers threw slower, breaking pitches were primitive, and hitters emphasized contact. Balls were put in play far more frequently than they would be in the modern game.
So while Orr’s exact strikeout number is unreliable, the overall high-contact environment of his era is real.
2. Orr Almost Never Walked
The most striking feature of Orr’s line that is not a recording artifact is his extremely low walk total:
- 98 walks in 3,411 plate appearances
Compare this with other elite hitters—albeit with two to three times as many games played:
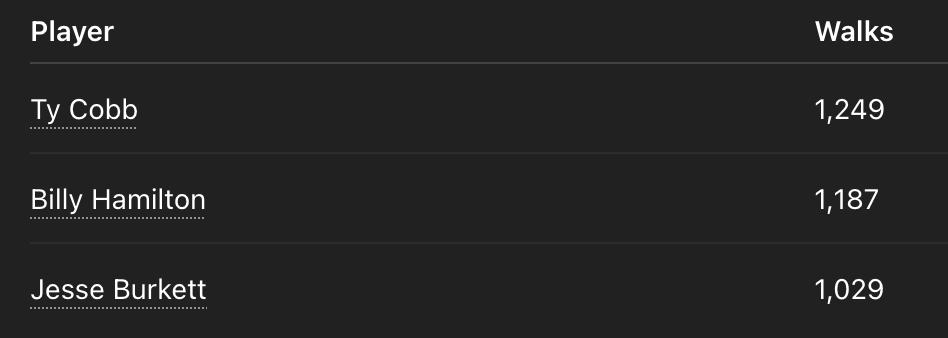
Those players accumulated large numbers of walks, which means many of their plate appearances did not produce official at-bats. Even with a three times multiplier on Orr’s games played to approach Cobb’s longevity, he remains at around 300 total theoretical walks.
Orr was different. Because he walked so rarely, almost every plate appearance became an opportunity to record a hit.
You can see this directly in his totals:
Plate appearances: 3,411
At-bats: 3,289
Nearly every trip to the plate resulted in a swing.
That dramatically increases the number of potential hit events per game.
3. Elite Batting Average
Orr also maintained an excellent batting average:
- .342 career batting average
This number itself is not unusual for the era. Many hitters of the late nineteenth century posted similar marks. For example:

What distinguishes Orr is not the average alone, but how it combines with his extremely high at-bat volume per game.
Because he rarely walked, that .342 average translated directly into a large number of hits.
4. Unusually High Extra-Base Hit Rate
Another feature that stands out in Orr’s record is the large number of extra-base hits relative to his career length.
From 1,125 total hits he produced:
198 doubles
108 triples
37 home runs
That equals 343 extra-base hits , meaning roughly 30% of his hits went for extra bases.
For a player in the 1880s, this indicates significant power for the era. His .502 slugging percentage confirms this. Orr was not simply collecting singles—he was hitting the ball hard.
This combination of high batting average and strong extra-base production helped maintain his overall hit rate.
5. A Short Career With No Decline Phase
Perhaps the most important structural factor is the length of Orr’s career.
791 games
Career ended at age 30
Orr’s career was cut short by a severe stroke. Because he retired so early, his record contains almost no aging decline.
Most great hitters accumulate several late-career seasons where performance drops. Those seasons gradually pull down their career rates.
Examples include players such as Ty Cobb, Nap Lajoie, and Cap Anson playing into their late thirties and even mid forties.
Orr’s statistical record, by contrast, is almost entirely prime performance.
That naturally inflates his career averages.
6. The Mathematical Mechanism Behind His Hits-per-Game Rate
Hits per game can be thought of as the product of three components:

In Orr’s case:
PA/G – normal for the era
AB/PA – extremely high (because he rarely walked)
H/AB – elite batting average
Because he maximized all three components simultaneously, his hits per game rose slightly above the range where most great hitters stabilize.
7. The Structural Context of the 1880s
The final piece of the puzzle is the environment of the era itself.
Baseball in the 1880s featured:
lower pitching velocity
primitive breaking pitches
very low strikeout rates
less advanced defensive positioning
These conditions produced more balls in play and therefore more opportunities for hits.
Later eras—with higher strikeout rates and stronger pitching arsenals—naturally suppress hit totals per game.
This is why most great hitters across baseball history cluster around 1.35–1.38 hits per game.
The Final Interpretation
Dave Orr’s apparent break from the historical ceiling does not arise from a single statistical anomaly. Instead it results from a combination of factors that all push the same variable—hit opportunities —in the same direction.
Those factors include:
An era that produced extremely high contact rates
An unusually low walk rate that maximized official at-bats
An elite batting average
Strong extra-base production
A short career that avoided late-career decline
Together they produce a hitter whose hits-per-game rate sits just above the natural equilibrium where most great hitters converge.
The difference may appear small numerically, but in a statistic where the entire elite range spans only a few hundredths, even a slight deviation is enough to make Orr appear as one of the most intriguing statistical outliers in baseball history.