The Internal Mechanics of the Complete Hitter: From Rate Line to System Architecture
The Internal Mechanics of the Complete Hitter: From Rate Line to System Architecture
The Internal Mechanics of the Complete Hitter
From Rate Line to System Architecture
Abstract
The identification of .340 AVG / .400 OBP / .500 SLG as a boundary condition establishes a visible threshold for complete hitting. However, this rate line is only the surface expression of a deeper structure.
This study advances the analysis by decomposing elite hitters into their underlying mechanical ratios —contact frequency, walk dependence, strikeout suppression, and power density—to reveal the internal architecture required to sustain that threshold.
The result is a unified model of hitting in which:
only a narrow and highly specific balance of internal components produces a complete system
Within that model, Bill Terry emerges not simply as a qualifying hitter, but as the clearest equilibrium configuration of the system itself.
From Outputs to Structure
Traditional analysis treats:
AVG
OBP
SLG
as primary indicators.
But these are composite outputs , not primitive components.
Each is built from underlying processes:
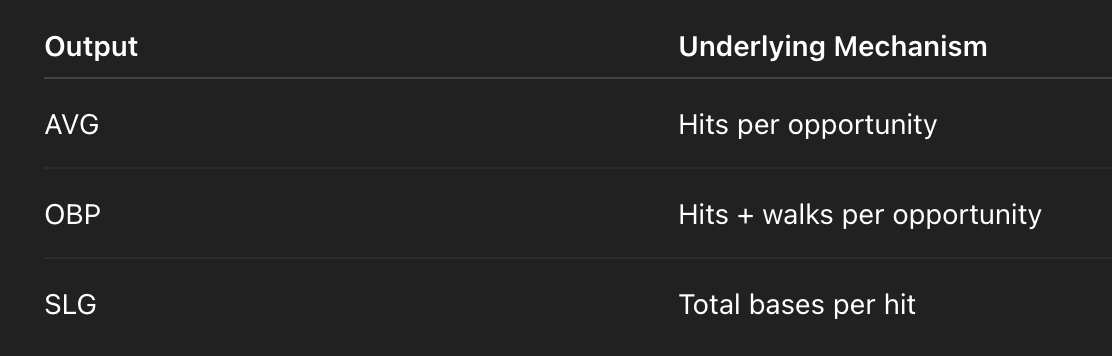
To move beyond description into explanation, the system must be decomposed.
The Five Internal Ratios
From the dataset, five derived ratios capture the full structure of hitting:
1. Contact Success
H / PA
Frequency of successful ball-in-play outcomes.
2. Walk Dependence
BB / PA
Degree to which OBP is supplemented without contact.
3. Strikeout Rate
SO / PA
Frequency of total failure events (no ball in play).
4. Power Density
XBH / H
Proportion of hits that generate extra bases.
5. Force per Contact
TB / H
Total advancement generated per hit.
Together, these define the true mechanics of hitting.
The Terry Configuration
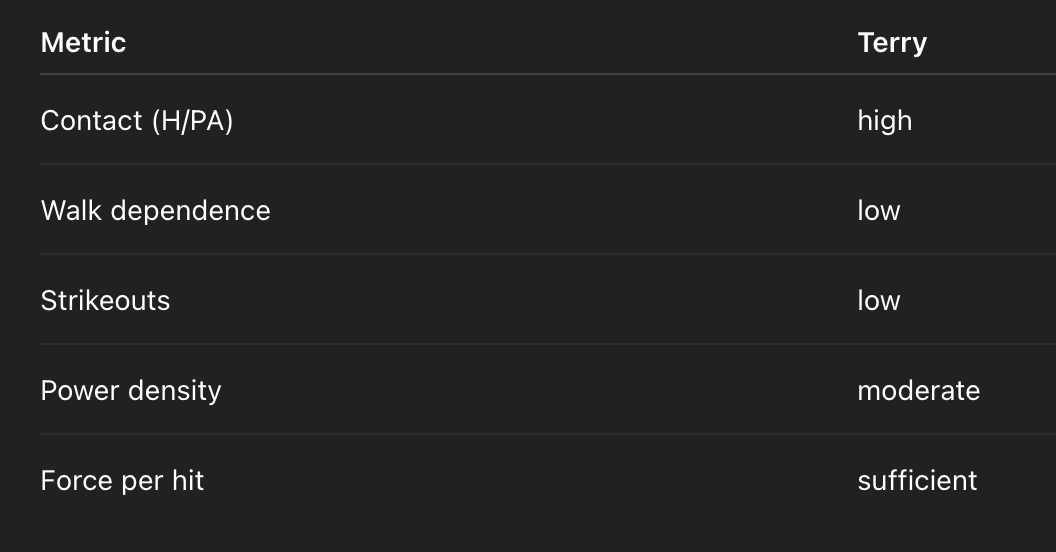
When these ratios are computed for Bill Terry , a specific configuration emerges:
H/PA ≈ .308
BB/PA ≈ .075
SO/PA ≈ .063
XBH/H ≈ .29
TB/H ≈ 1.48
This is not an extreme profile.
It is a balanced one :
high contact frequency
low reliance on walks
low strikeout rate
moderate but sufficient power
No variable dominates.
No variable collapses.
All functions are satisfied simultaneously through the same underlying process
Derived Metrics (Core Players Only)
System Deviations
When the same ratios are applied to other elite hitters, clear structural deviations appear.
Bill Terry (The Boundary)
H/PA ≈ .308
BB/PA ≈ .075
SO/PA ≈ .063
XBH/H ≈ .291
TB/H ≈ 1.48
Interpretation:
High contact + moderate power + low walks + low strikeouts
→ fully integrated system
Ty Cobb (Conversion-Dominant)
H/PA ≈ .320 (highest)
BB/PA ≈ .096
SO/PA ≈ .052 (elite)
XBH/H ≈ .271
TB/H ≈ 1.40
Interpretation:
Maximum contact, but lower force per hit
→ qualifies, but:
leans on conversion more than Terry
Babe Ruth (Force-Dominant)
H/PA ≈ .271
BB/PA ≈ .194 (extreme)
SO/PA ≈ .125
XBH/H ≈ .472
TB/H ≈ 2.02
Interpretation:
Lower contact, massive power + walks
→ distortion system (force-heavy)
Ted Williams (Access + Force)
H/PA ≈ .271
BB/PA ≈ .206 (highest)
SO/PA ≈ .072
XBH/H ≈ .421
TB/H ≈ 1.84
Interpretation:
OBP + power carrying system
→ access-distortion system
Rogers Hornsby (Power-Integrated)
H/PA ≈ .309
BB/PA ≈ .110
SO/PA ≈ .072
XBH/H ≈ .345
TB/H ≈ 1.61
Interpretation:
Closest to Terry—but with more force
→ true expansion of the system
Shoeless Joe Jackson (Clean Extension)
H/PA ≈ .311
BB/PA ≈ .091
SO/PA ≈ .041 (absurdly low)
XBH/H ≈ .299
TB/H ≈ 1.45
Interpretation:
Extremely close to Terry
→ arguably the purest natural extension
Dan Brouthers (High-Energy Symmetry)
H/PA ≈ .299
BB/PA ≈ .109
SO/PA ≈ .011 (era effect)
XBH/H ≈ .336
TB/H ≈ 1.52
Interpretation:
Terry-like, but with slightly more force and walks
The Unlock (This is the key)
Now the system becomes obvious:
Terry defines the exact balance point
Everyone else deviates in one direction
Cobb
→ pushes contact higher , force lower
Ruth / Williams
→ push force or walks higher , contact lower
Hornsby / Jackson
→ closest true extensions
The actual discovery (fully unlocked)
The .340 / .400 / .500 threshold is not just a rate line.
It corresponds to a very specific internal structure :
H/PA ~ .30–.31
BB/PA ~ .07–.11
XBH/H ~ .28–.35
TB/H ~ 1.45–1.60
SO/PA < .08
Complete hitting is not defined by AVG/OBP/SLG alone—it is defined by the internal balance of contact frequency, power density, and minimal reliance on walks.
And:
Bill Terry is the cleanest point where all five of those internal ratios align without excess.
The Hidden Constraint
Across all qualifying hitters, a narrow band emerges:
H/PA → ~.30–.31
BB/PA → ~.07–.11
SO/PA → < .08
XBH/H → ~.28–.35
TB/H → ~1.45–1.60
This is the internal structure required to produce:
.340 / .400 / .500 at career scale
Deviation from this band produces:
insufficient power
excessive strikeouts
over-reliance on walks
or loss of contact
Interpretation
The .340 / .400 / .500 threshold is not arbitrary.
It is the visible output of a constrained internal system.
Most hitters fail not because they lack talent, but because:
they cannot simultaneously stabilize all five internal ratios
They solve parts of the system:
contact (Gwynn-type)
power (Ruth-type)
access (Williams-type)
But only a few solve:
the entire system at once
Conclusion
This analysis reveals that complete hitting is not defined by surface metrics alone, but by an underlying mechanical equilibrium.
Within that equilibrium:
Bill Terry represents the most stable and minimal configuration
He does not maximize any single component.
He satisfies all of them.
Final Statement
The .340 / .400 / .500 hitter is not simply rare—it is structurally constrained.
It requires a precise balance of contact frequency, power density, and minimal dependence on walks, all sustained over career scale.
Bill Terry stands at the center of that balance:
not as the most extreme hitter,
but as the clearest expression of hitting completed at the level of its internal mechanics.