The Ruthian Curve: Time, Visibility, and the Re-Expansion of the Run Climate (1920–1935)
The Ruthian Curve: Time, Visibility, and the Re-Expansion of the Run Climate (1920–1935)
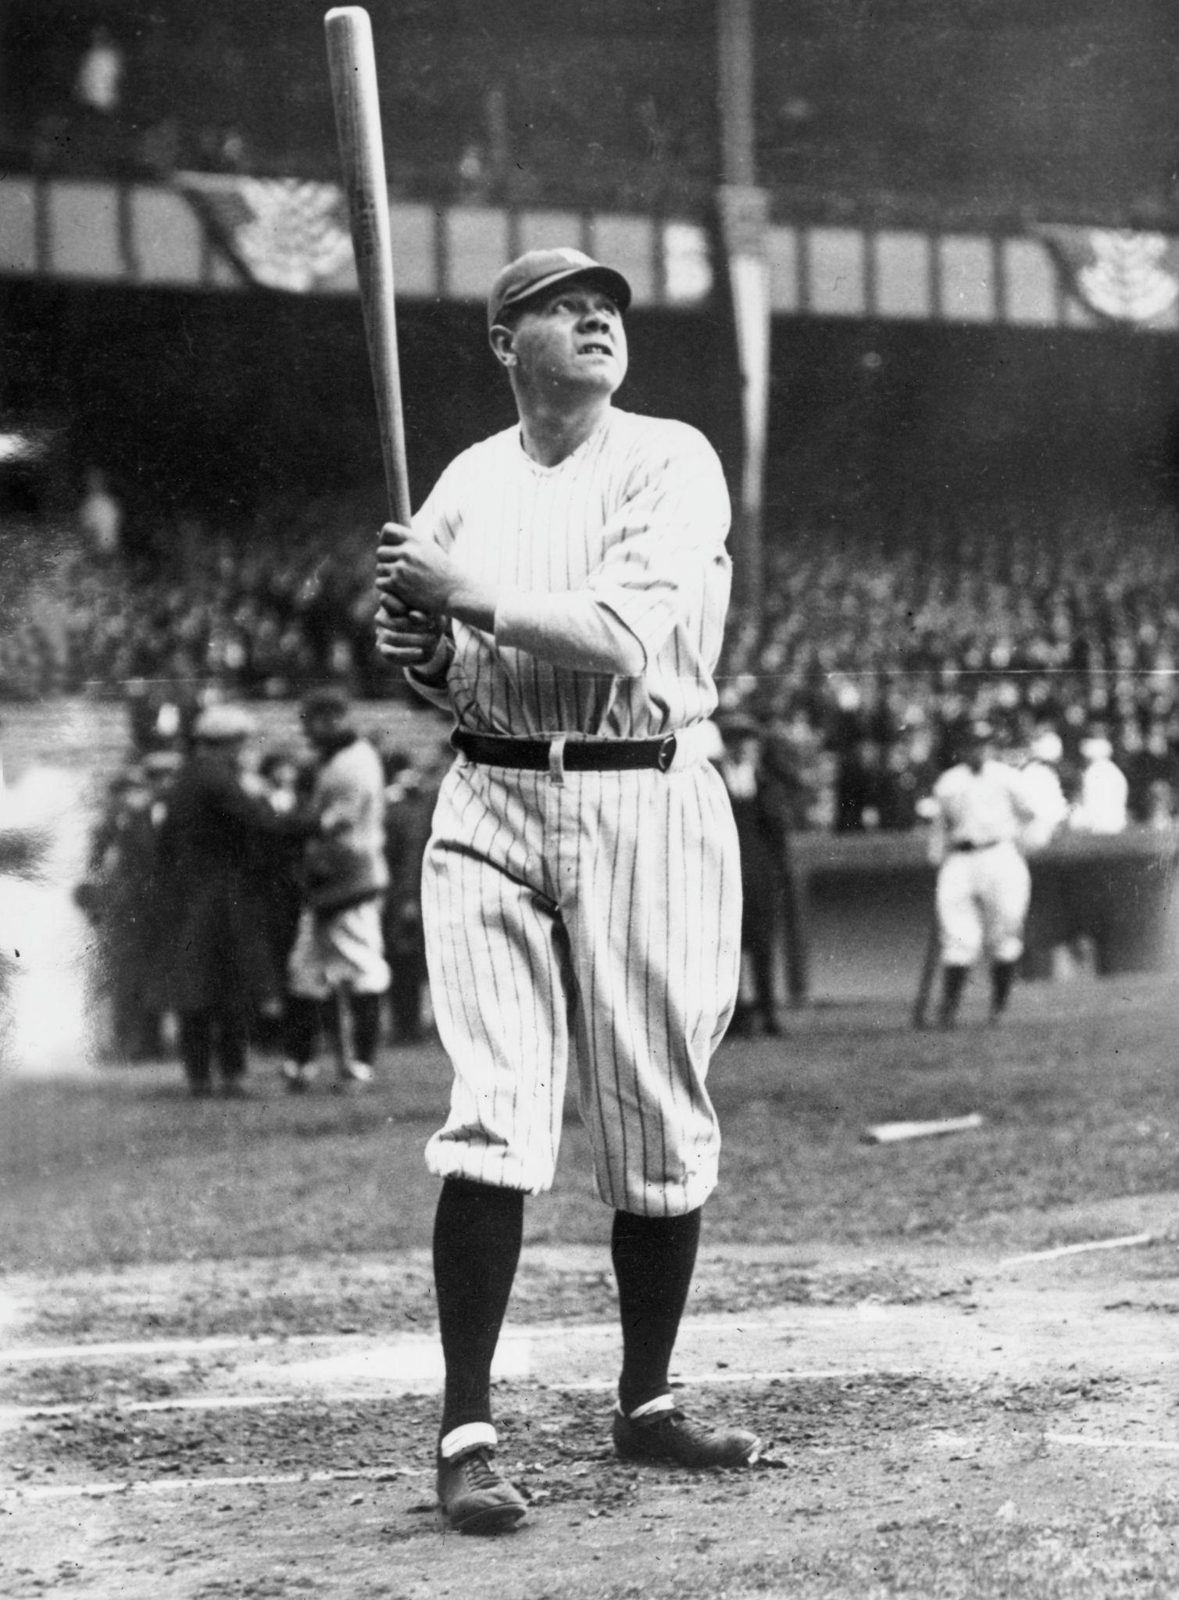
The Ruthian curve is the first modern expansion of baseball’s reaction window.
The Ruthian Curve
Time, Visibility, and the Re-Expansion of the Run Climate (1920–1935)
Baseball’s run history is not a sequence of stylistic fashions. It is a thermodynamic record of who controls time.
If the Deadball era represents the hard consolidation of suppression — a regime in which pitchers and environmental opacity compressed the hitter’s reaction window — then the Ruthian era represents the opposite event:
a systemic re-expansion of perceptual time.
The Ruthian curve (roughly 1920–1935) is not simply a “home run boom.” It is the re-opening of the reaction-time economy after two decades of constriction.
I. The Deadball Baseline: Compression of Perception
From 1900–1919, the run environment collapses into what can be called the Deadball cavern. This was not accidental.
It was the product of:
Darkened, scuffed baseballs remaining in play
Reduced visual clarity late in games
Larger parks penalizing carry
Strategic adaptation to scarce clean contact
Pitching refinement within post-1893 geometry
In reaction-time terms:
Hitters saw less.
Committed earlier.
Guessed more.
Drove fewer balls cleanly.
Runs fell because the reaction window narrowed and perceptual certainty declined.
The cavern is not proof of inferior hitting ability.
It is proof of environmental opacity.
II. The Shock of 1920: Restoring Legibility
The Ruthian curve begins with environmental clarity.
After the fatal beaning of Ray Chapman in 1920, Major League Baseball began replacing dirty baseballs more frequently. The spitball was restricted. Offensive conditions shifted.
The result:
Cleaner, brighter balls
Improved visual tracking
More stable flight predictability
Increased carry
Fewer unpredictable deflections
This is not anecdotal romance about livelier cork. It is perceptual physics.
When visibility improves:
Pitch recognition sharpens
Swing commitment confidence increases
Clean contact frequency rises
The game becomes legible again.
The run environment rises accordingly.
III. Babe Ruth as the Structural Catalyst
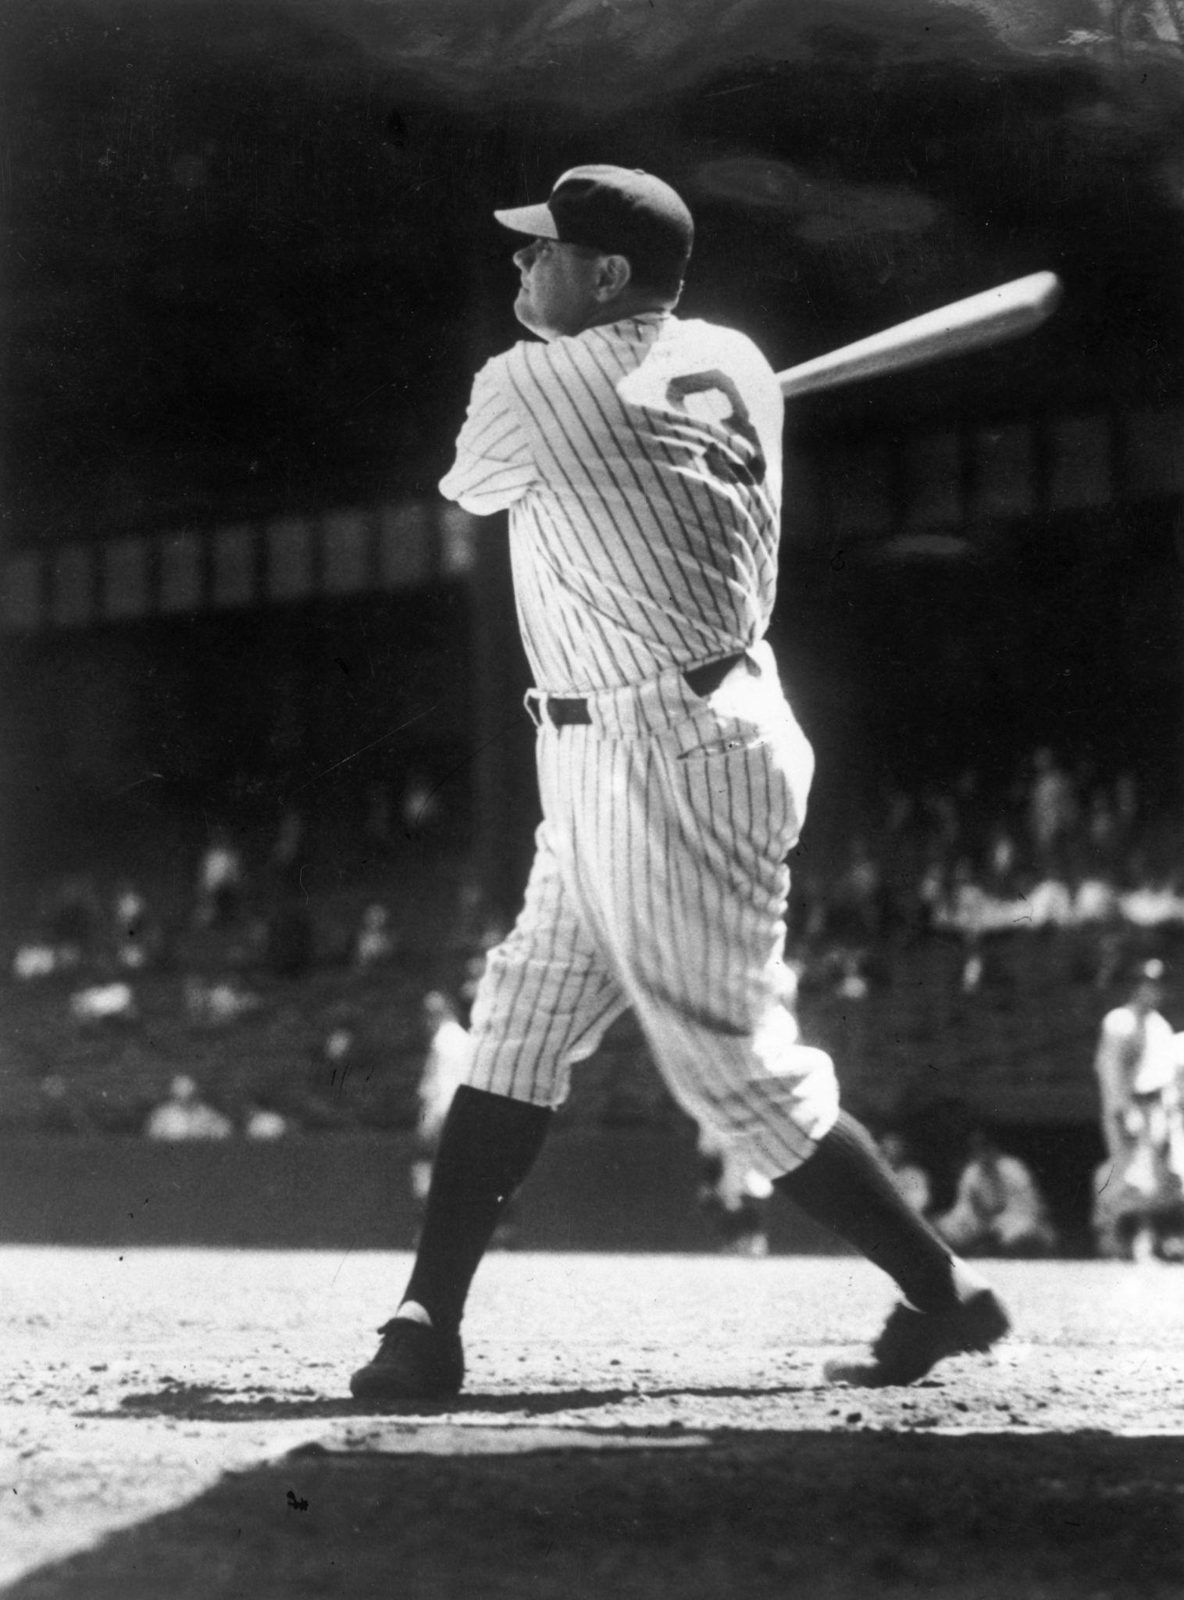
No figure embodies the curve more than Babe Ruth.
But Ruth is not the cause of physics.
He is the first player to fully exploit it.
Ruth’s innovation was not brute strength alone. It was strategic reorientation :
Elevation over ground-ball contact
Power as primary run engine
Acceptance of strikeouts in exchange for impact
He recognized — consciously or not — that the reaction window had widened.
Where Deadball hitters optimized for survival, Ruth optimized for domination within expanded time.
His 1920 season (54 HR) is not merely statistical excess.
It is a signal:
The reaction window is large enough to support sustained power conversion.
Once proven viable, others follow.
IV. The Ruthian Sky: Run Climate Expansion
From 1920 through the early 1930s, league-wide runs per game rise into a new equilibrium band (roughly ~5 runs per game in peak seasons).
This is not chaos.
It is a new stable sky.
Why stable?
Because pitchers adapt.
They introduce:
Greater velocity emphasis
Refined breaking pitches
Evolving sequencing
But unlike the Deadball cavern, suppression never fully regains its former opacity.
The perceptual baseline remains clearer than 1900–1919.
The game has modernized.
The sky expands, but then stabilizes.
V. The Reaction-Time Reallocation
The Ruthian curve is structurally analogous to 1893 — but via different hardware.
1893
Distance increased → more flight time → more milliseconds → more offense.
1920
Visibility increased + carry increased → more perceptual certainty → more offense.
In both cases:
The hitter sees more of the ball’s story before committing.
The key variable is not emotion.
It is not mythology.
It is milliseconds of usable information.
VI. Why the Curve Does Not Climb Forever
A common misunderstanding is that offense “exploded” permanently in 1920.
It did not.
It rose, then plateaued.
Why?
Because equilibrium returns.
Pitchers recalibrate:
Higher velocity
Better command
Adjusted approach angles
The system oscillates but does not spiral.
Baseball self-regulates around perceptual balance.
The Ruthian era is not chaos.
It is a new timing regime.
VII. The Deeper Meaning of the Ruthian Curve
The Ruthian curve marks baseball’s entry into modernity.
The Deadball era was suppression-dominant and opacity-driven.
The Ruthian era is:
Visible
Legible
Power-oriented
Airborne
It is the first time baseball fully accepts elevation as strategy and spectacle.
It is the first time the reaction-time economy is wide enough to sustain consistent long-ball conversion.
And crucially:
It demonstrates that baseball is not bound to a single run climate.
It can be mechanically recalibrated.
VIII. The Ruthian Curve in the Larger Oscillation
Seen within the full arc of baseball history:
1870s: open inefficiency
1880s: suppression consolidation
1893: distance time transfer
1900–1919: suppression cavern
1920–1935: perceptual expansion
1968: suppression overreach
1969: mound recalibration
The Ruthian curve is the first modern expansion after the Deadball contraction.
It proves that:
Run climate is not narrative fluctuation.
It is a reaction-time equilibrium state.
Conclusion: Ownership of the Window
The Ruthian era is not simply about Babe Ruth.
It is about the moment baseball re-opened the window.
When hitters gained:
clarity
carry
confidence
the sky expanded.
Ruth did not invent physics.
He recognized its new boundaries faster than anyone else.
The Ruthian curve is therefore the moment when baseball’s hidden engine — the reaction-time economy — shifted toward legibility and power, and the modern game was born.