Top 35 Hitters & Starting Pitchers of the Pre-1980 Career Era (Tail-Logged Unified Rank)
Top 35 Hitters & Starting Pitchers of the Pre-1980 Career Era (Tail-Logged Unified Rank)
Top 35 Hitters & Starting Pitchers of the Pre-1980 Career Era (Tail-Logged Unified Rank)
Definition: this ranking is not “how far above average,” it’s how deep into the historical tail a player sits within his role (hitters ranked among hitters; pitchers among pitchers), then unified on a single tail scale.
Minimum PA 3000; Minimum IP 1000.
Data here referencing pre-integration Black and Cuban baseball players taken from the Seamheads Digital Database; all post integration and historical MLB statistics taken from Baseball Reference.
(Format: Rank. Player (Role) — OPS+/ERA+ — TailLog)
1. Babe Ruth (H) — 206 — 4.220
2. Satchel Paige (P) — 159 — 4.060
3. Josh Gibson (H) — 202 — 3.121
4. Lefty Grove (P) — 148 — 2.962
5. Ted Williams (H) — 191 — 2.610
6. Walter Johnson (P) — 147 — 2.451
7. Lou Gehrig (H) — 179 — 2.274
8. Ed Walsh (P) — 146 — 2.115
9. Buck Leonard (H) — 175 — 2.022
10. Joe Wood (P) — 146 — 1.863
11. Rogers Hornsby (H) — 175 — 1.822
12. José Méndez (P) — 145 — 1.663
13. Turkey Stearnes (H) — 173 — 1.655
14. Cristóbal Torriente (H) — 172 — 1.511
15. Joe Williams (P) — 143 — 1.495
16. Oscar Charleston (H) — 172 — 1.386
17. Addie Joss (P) — 143 — 1.352
18. Mickey Mantle (H) — 172 — 1.275
19. Carlos Royer (P) — 142 — 1.227
20. Pete Hill (H) — 171 — 1.175
21. Ray Brown (P) — 142 — 1.116
22. Dan Brouthers (H) — 171 — 1.084
23. Bullet Rogan (P) — 141 — 1.016
24. Shoeless Joe Jackson (H) — 170 — 1.001
25. Kid Nichols (P) — 139 — 0.925
26. Ty Cobb (H) — 168 — 0.924
27. Mule Suttles (H) — 164 — 0.852
28. Mordecai Brown (P) — 138 — 0.842
29. Jimmie Foxx (H) — 163 — 0.786
30. Cy Young (P) — 138 — 0.765
31. Pete Browning (H) — 163 — 0.723
32. Christy Mathewson (P) — 136 — 0.693
33. Dave Orr (H) — 162 — 0.664
34. Grover Cleveland Alexander (P) — 135 — 0.626
35. Hank Greenberg (H) — 159 — 0.609
Publishable Formula and Explanation
The Tail-Logged Dominance Index (TLDI)
OPS+ and ERA+ are both indexed to 100, but they do not share the same distribution shape historically:
OPS+ has a long right tail (some hitters reach 190-200+ career).
ERA+ is structurally compressed (career 160 is already near the ceiling).
So if we compare raw index values directly, pitchers get undercounted in “how extreme” they are.
This model defines “equivalence” by rarity :
A pitcher and a hitter are equal if they are equally deep into the historical tail within their role.
Step 1 — Rank within role and convert to a tail probability
For each role (hitters and pitchers separately), let:
(N) = number of qualified players in that role universe
(r) = player’s rank within that role by the index stat (1 = best)
Define the upper-tail probability (with a half-step smoothing so nothing becomes infinite):
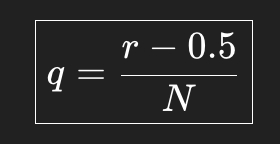
This (q) is “how much of the role-population is at least as extreme as you” in rank terms.
Step 2 — Log the tail
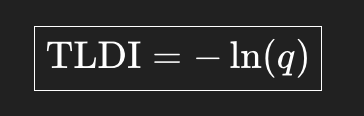
Interpretation:
If you are in the top 1% of your role, (q=0.01), TLDI (=4.605)
If you are in the top 0.1% , (q=0.001), TLDI (=6.908)
So the score is literally:
Log-scaled tail rarity.
Step 3 — Unify roles
Because both roles are now expressed in the same unit (log tail rarity), we can rank hitters and pitchers together:

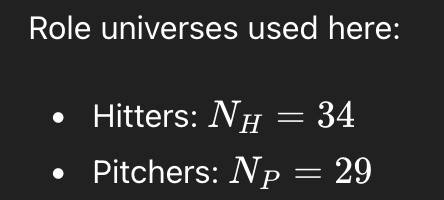
This demonstrated model evaluates dominance extremity within a pre-filtered elite universe, not across the total historical population.
What This Model Claims (and what it doesn’t)
It claims:
This is a unified list of career dominance extremity measured by historical rarity within role.
It does not claim:
Total career value, longevity, defense, postseason, or WAR-style accumulation.