The Reaction-Time Switch: The Hidden Physics of Baseball’s Run Climate, 1871–1919 — and the 1968 Mound Countershock
The Reaction-Time Switch: The Hidden Physics of Baseball’s Run Climate, 1871–1919 — and the 1968 Mound Countershock
The Reaction-Time Switch
The Hidden Physics of Baseball’s Run Climate, 1871–1919 — and the 1968 Mound Countershock
A baseball season is not only a schedule of games. It is a physical system. And the most important variable in that system is not “talent,” “strategy,” or even the ball. It is time.
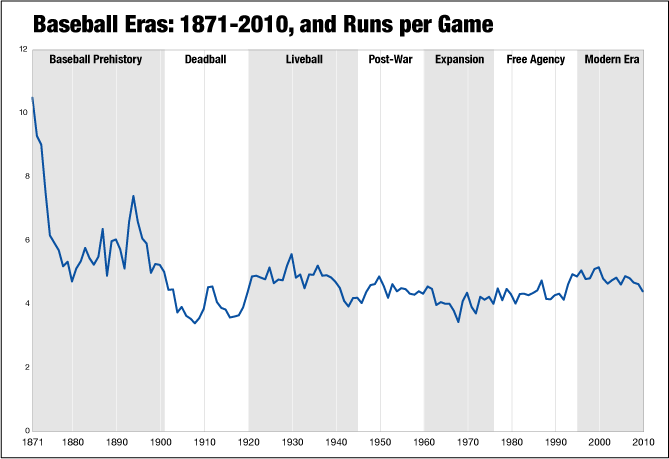
The run curve you’re looking at is not a narrative curve. It is a reaction-time curve — a record of when hitters gained or lost milliseconds, and when pitchers regained or lost control of the game’s timing architecture.
Baseball history, in its deepest sense, is the history of who owns the reaction window.
This document explains the essential physics behind the graph’s most dramatic movements:
the massive early collapse of runs in the 1870s–1880s,
the momentous reversal spike of the early–mid 1890s,
the plunge into the Deadball cavern (1900–1919),
and finally,the modern “pitcher reclamation” event of 1968 , and how baseball countered it by changing mound physics in 1969.
I. The Run Curve as a Physics Instrument
Runs per game is often treated as “context.” But it is better understood as the system’s output signal — a composite measure of:
time to perceive (ball visibility and release point),
time to decide (pitch recognition and commitment),
time to execute (swing mechanics and contact precision),
time to disrupt (pitch movement and deception),
and the material conditions of play (rules, equipment, ball condition, and park geometry).
In this sense, runs per game is the audible readout of baseball’s hidden engine:
the reaction-time economy.
When hitters gain time, offense expands.
When pitchers reclaim time, offense contracts.
The “eras” on the chart are not merely cultural labels. They are timing regimes.
II. The Great Early Downturn (1871 → 1880s): From Chaos to Constraint
At the far left of the chart, runs per game begin in a high-scoring zone that looks alien compared to modern baseball. This is the residue of baseball’s early professionalization: looser rules, inconsistent equipment, and incomplete stabilization of competitive technique.
What follows is one of the most important transitions in the sport:
the movement from open scoring chaos into organized suppression.
Why the early collapse occurred
It is important to note that this downturn was not caused by a single rule change. Rather, it reflected the consolidation of professional league structure, improved defensive coordination, refinement of pitching mechanics, and stabilization of competitive scheduling. As leagues stabilized and talent concentrated, inefficient conversion of batted balls diminished.
The early run decline is therefore the sport’s first great compression event: baseball becoming systematized.
The key idea is this:
Early baseball begins in a state of inefficient conversion — outs are hard to secure, so runs flood the system.
As conversion tightens, the system cools.
III. The 1890s Spike: The Reaction-Time Trade-Switch
Then the curve turns upward in the early–mid 1890s. This is not “hitters suddenly improved.” It is a geometry shock.
The switch: 1893
In 1893, the National League moved pitching to 60 feet, 6 inches. The change was immediate.
This is the pivotal act on the graph:
a transfer of milliseconds from pitcher to hitter.
That transfer of milliseconds is the hidden physics behind the spike.
Why milliseconds matter
At high speeds, distance is time. A longer flight time means:
more pitch recognition,
later decision commitment,
cleaner contact,
fewer forced swings,
less dominance by pure velocity/proximity.
Even at conservative velocity estimates for the 1890s — generally believed to be below modern elite velocities but still fast enough to compress reaction time significantly — the change from roughly 50 feet to 60 feet, 6 inches likely increased pitch flight time on the order of 40–60 milliseconds , depending on speed.
That range alone represents a substantial increase in perceptual processing opportunity. Human swing commitment typically begins within roughly 150–200 milliseconds of release. An added 40–60 milliseconds expands the proportion of trajectory visible before commitment.
The 1893 spike is therefore not metaphorical. It is physically consequential.
Put simply:
the hitter’s brain gets to see more.
The game becomes more legible.
The run environment rises.
Skill inversion
Before the move, pitching had built-in leverage: proximity compression.
After the move, that leverage is diluted.
Old dominance loses leverage.
New dominance requires adaptation.
IV. 1893–1899: The Adaptation Laboratory
The mid-1890s are not just “high offense.” They are baseball’s first major modernization lab.
Two things happen simultaneously:
hitters are temporarily advantaged by time,
pitchers redesign suppression inside the new geometry.
This is why the curve stabilizes rather than climbing forever:
The mound move increases offensive entropy.
Pitching evolves to reduce it.
V. The Deadball Cavern (1900–1919): The Great Run Collapse
After the brief tide-turn of the 1890s, the curve drops again — and it drops hard.
The Deadball cavern is best understood as the second great consolidation of suppression: the moment when pitchers and run prevention fully mastered the post-1893 geometry, and the entire system tilted toward obscurity and contact failure.
Why runs collapsed so profoundly
Pitch design and surface manipulation
More movement and deception reduce predictability. Reduced predictability destroys timing.Ball condition and visibility decay
A darkened, scuffed, softening ball reduces visual certainty and reduces carry. This is reaction-time warfare: less visibility → less confidence → less hard contact.Park geometry
Larger outfields increase the distance cost of power. Hard contact yields fewer instant runs.Strategic response
Deadball “small ball” is not the cause — it is the adaptation. When clean contact is scarce, teams manufacture.
The Deadball era is therefore not a quaint style.
It is the culture that emerges when:
suppression has reclaimed time and made power expensive.
The cavern is not evidence of inferior hitters, but of an environment that systematically reduced clean contact probability.
VI. Baseball as Timing Oscillator
Now the early part of the curve reads as a single coherent system:
1870s: open system, inefficient outs
1880s: suppression consolidates
1893: time gift to hitters via geometry shock
1900–1919: suppression overconsolidates into the cavern
And the same physics returns later in modern form.
VII. 1968: The Modern Pitcher Reclamation Event
On your graph, 1968 sits near the bottom of the post-war band — a sudden depression in offense known historically as the “Year of the Pitcher.”
But what matters here is not the label.
What matters is the physics.
By the late 1960s, pitchers had once again seized too much of the reaction-time economy through a combination of:
increased velocity
better pitch design and spin
strike zone interpretation that expanded the effective upper zone
and a mound that provided strong mechanical leverage
The system drifted toward suppression.
In 1968, that drift reached crisis visibility.
Runs fell. Offense compressed. The league looked structurally unbalanced.
Baseball responded with a direct environmental correction.
1969: Mound physics changes
MLB lowered the mound from 15 inches to 10 inches beginning in 1969, and also adjusted the strike zone enforcement.
This is not cosmetic.
Lowering the mound reduces the pitcher’s mechanical advantage:
A higher mound increases downward plane and effective extension, altering perceived vertical approach angle and making high-velocity fastballs appear to “rise” relative to hitter expectation. Lowering the mound reduces that leverage and marginally increases hitter reaction confidence.
Just as 1893 transferred time through distance, 1969 transferred time through release geometry.
Both interventions recalibrated the same variable: perceptual certainty.
It is, again, a reaction-time adjustment — not by moving the plate, but by changing the delivery physics.
Where 1893 is a distance-based timing shift, 1969 is a release-geometry and plane shift.
Both are structural interventions.
Both redistribute time.
VIII. The Deep Parallel: 1893 and 1968 Are the Same Story in Different Hardware
1893:
- time transferred to hitters by increasing flight time (distance)
1968/1969:
- time transferred to hitters by reducing pitcher leverage (mound height) and zone conditions
In both cases the league is performing the same act:
correcting an imbalance in the reaction-time economy.
Baseball does not regulate “fairness” in moral terms.
It regulates equilibrium in physical terms.
When suppression becomes too strong, the league changes the environment.
When offense becomes too strong, the league tolerates suppression innovations until equilibrium returns.
This is why the curve oscillates across eras.
Conclusion: The Hidden Engine of the Run Curve
The graph is a record of an invisible struggle over milliseconds.
The 1890s spike is the moment hitters are granted time.
The Deadball collapse is the system’s response: suppression takes time back and hardens it into era.
1968 is the modern recurrence: a new consolidation of suppression makes offense scarce again, and the league intervenes by altering mound physics.
The curve is therefore not merely history.
It is the readout of baseball’s deepest constant:
a perpetual contest over perception, decision, and the right to see.