The Run Atmosphere Constitution: A Phase-Based Method for Cross-Era Baseball Evaluation
The Run Atmosphere Constitution: A Phase-Based Method for Cross-Era Baseball Evaluation

The Run Atmosphere Constitution
A Phase-Based Method for Cross-Era Baseball Evaluation
Baseball history is not a single continuous scoring field.
It is a sequence of run-environment phases — distinct atmospheric climates in which the structure of scoring changes.
To compare players across eras without flattening those structural discontinuities, we must first define the scoring atmosphere in which the game functioned, and then measure how much of that atmosphere each player controlled.
This model does not measure distance from average.
It measures share of scoring atmosphere controlled within a defined phase.
I. Phase Architecture (The Skies)
Baseball history is partitioned into three scoring phases (“skies”), defined strictly by empirically observed league scoring climates.
These phases are not narrative labels.
They are scoring regimes.
Phase 1 — Deadball Climate (including 1890s-equivalent sky)
A low-run environment defined by shared league-average runs per team per game across the 1890s and 1900–1919.

The 1890s and early 20th century form a single run-atmosphere equivalence class due to statistically indistinguishable scoring environments within the tolerance band of this model.
Phase 2 — Ruthian Climate (1920–1935)
The high-run live-ball peak.

This marks the structural shift introduced by live-ball conditions and power-based offensive transformation.
Phase 3 — Late Live-Ball / Pre-Expansion Integrated Climate (1935–1960)
The post-peak mid-century scoring plateau and the onset of full integration.

This phase is defined by scoring climate, not by wartime narrative. WWII is not causal within this model; the phase boundary reflects a structural scoring shift from the 1920–1935 peak.
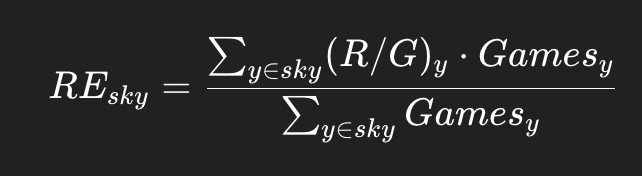
Empirical Determination of RE
For each phase:
Where:
(R/G) = league runs per team per game
Games = season length weighting
Thus, skies are empirically derived scoring environments.
II. Core Metric: Atmospheric Share (AS)
Dominance is defined as:
The fraction of the phase’s total scoring atmosphere controlled by a player.
All values are expressed as shares of the phase’s run environment.
III. Hitting Module
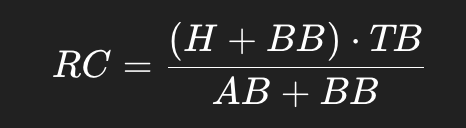
Step 1: Compute Runs Created
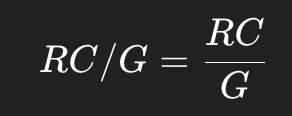
Step 2: Convert to Per-Game Production
Step 3: Compute Atmospheric Share (Hitting)
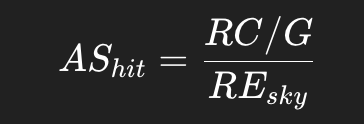
Interpretation:
If (AS_{hit} = 0.22), the hitter generated 22% of a full team’s scoring atmosphere per game within that phase.
IV. Pitching Module
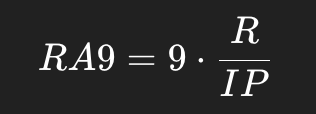
Step 1: Compute Runs Allowed per 9
Step 2: Compute Atmospheric Suppression
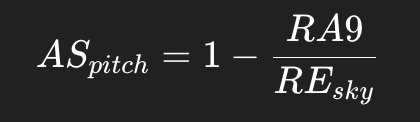
Interpretation:
If (AS_{pitch} = 0.35), the pitcher suppressed 35% of the phase’s scoring atmosphere per full-game equivalent.
If (AS_{pitch} < 0), the pitcher inflated the atmosphere relative to phase baseline.
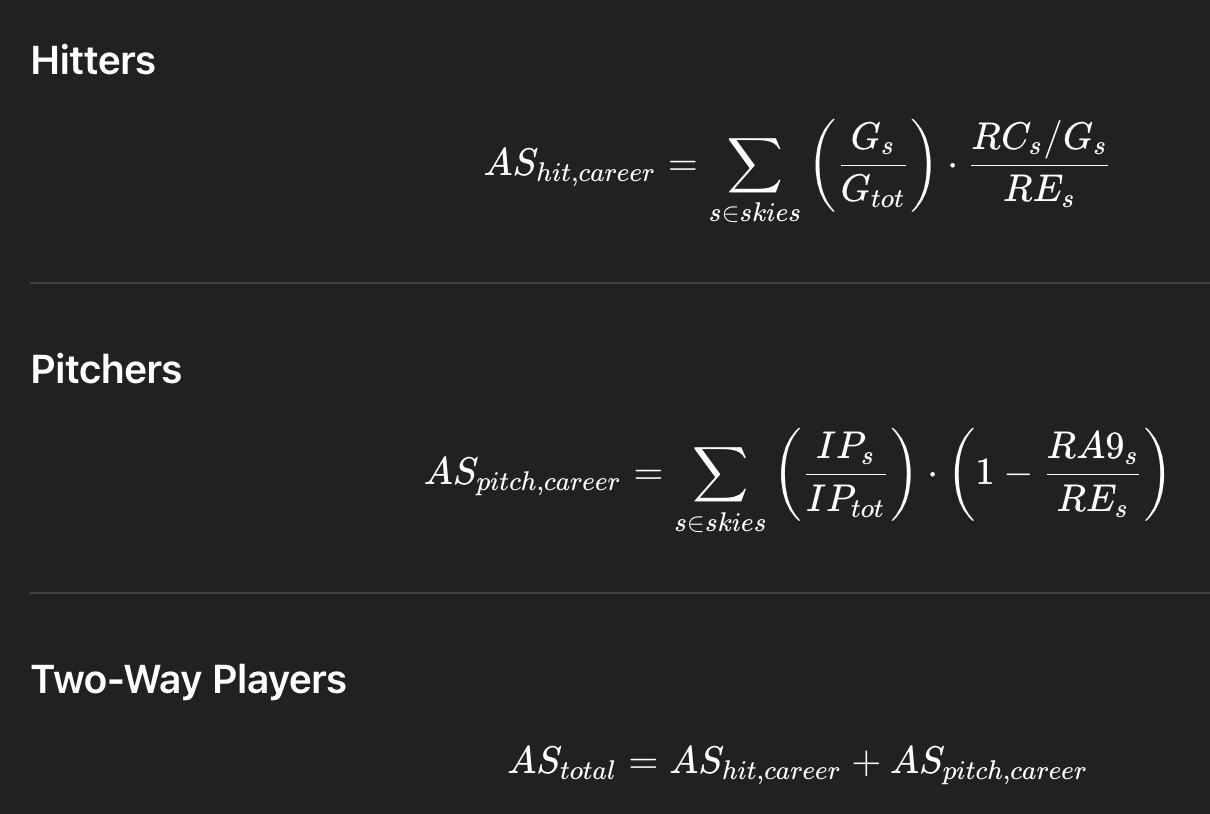
V. Multi-Phase Career Aggregation
Players spanning multiple skies are weighted by exposure.
VI. Structural Properties of the Model
1. Environmental Compression
Low-scoring climates mechanically increase marginal leverage.
In a 3.72 sky, each run constitutes a larger fraction of atmospheric throughput than in a 5.08 sky.
This is not a bias of the model.
It reflects structural game mechanics.
2. Robustness to RE Drift
If (RE_{sky}) shifts moderately (±0.10–0.20), ordering within that sky remains stable because all players scale proportionally.
The architecture is denominator-robust.
3. Replacement Neutrality
This model measures atmospheric share, not replacement-level surplus.
Durability is weighted by exposure (G or IP), not by scarcity modeling.
VII. Integration Density Layer (Version 1.1)
Version 1.0 isolates scoring-phase discontinuity.
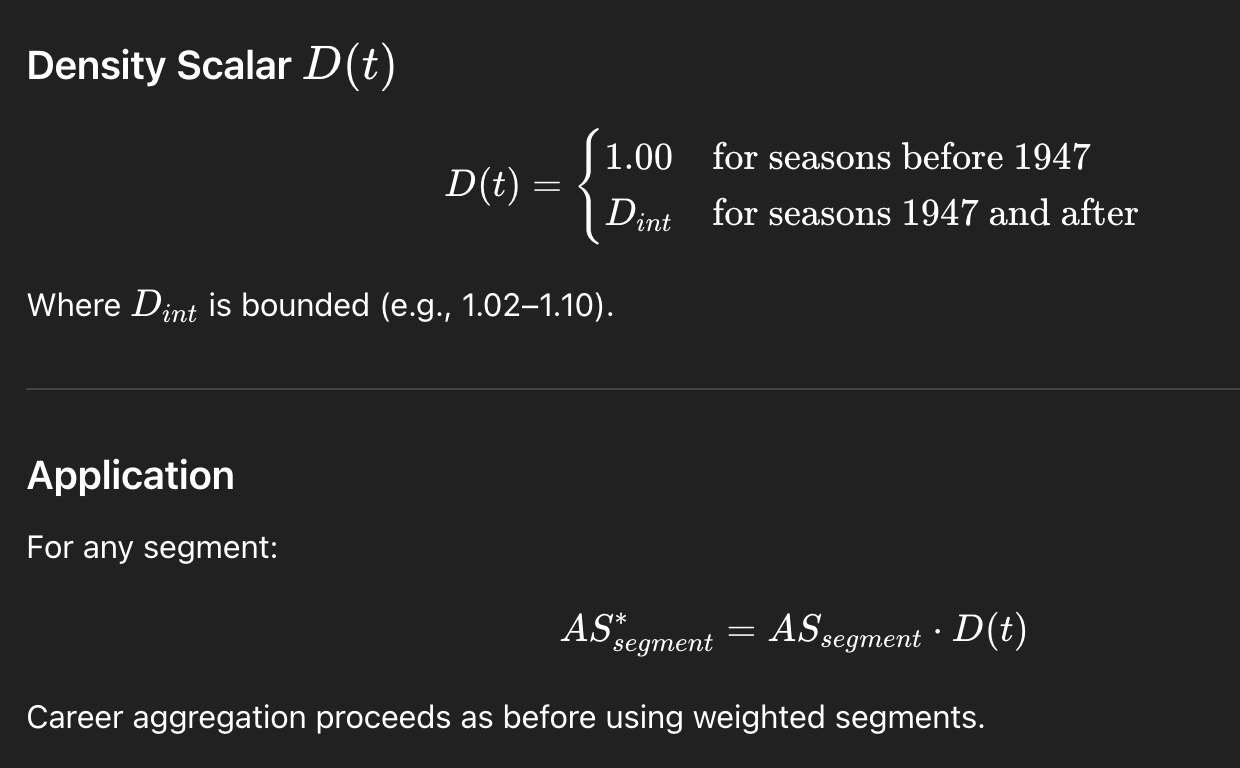
Integration represents a separate structural shift: competition-density expansion beginning in 1947.
Rather than embed this assumption implicitly, we represent it with a bounded scalar.
Rationale
This preserves:
Orthogonality between run environment and competition density
Transparency of assumptions
Stability under sensitivity testing
If results remain stable across plausible (D_{int}) values, the model is density-robust.
VIII. What This Model Solves
This framework:
• Corrects for run-environment phase shifts
• Preserves environmental compression
• Avoids dispersion modeling
• Unifies multi-era careers under one denominator
• Integrates two-way players cleanly
It does not claim to solve every historical discontinuity.
It isolates scoring architecture as the primary structural fracture and resolves it directly.
IX. Constitutional Principle
Baseball dominance is not distance from average.
It is atmospheric control.
Define the phase.
Compute the share.
Aggregate across skies.
Layer density transparently.
When phases are defined empirically and shares are computed mechanically, cross-era evaluation becomes structurally unified rather than narratively reconciled.
Not myth.
Not dispersion inflation.
But measurable control of the scoring atmosphere in which the game functioned.