The Run Atmosphere Constitution: A Unified Ranking of Deep Baseball History
The Run Atmosphere Constitution: A Unified Ranking of Deep Baseball History
The Run Atmosphere Constitution
A Unified Ranking of Deep Baseball History
Baseball history is not a single continuous scoring field.
It is segmented by epochal climates — distinct run environments that alter the physics of dominance.
To compare players across segregated leagues, role types, and scoring regimes, we do not measure separation from average.
We measure penetration into the era’s scoring atmosphere.
I. The Architecture of the Solution
1) Declare the Sky (Run Atmosphere)
Each epoch receives a declared scoring climate:
Deadball Sky (1900–1919) → RE = 3.72 runs/game
Ruthian Sky (1920–1935) → RE = 5.08 runs/game
WWII/Integrated Sky (Williams era) → RE = 4.65 runs/game
Dominance is measured relative to the sky — not relative to league average.
2) Hitting Module
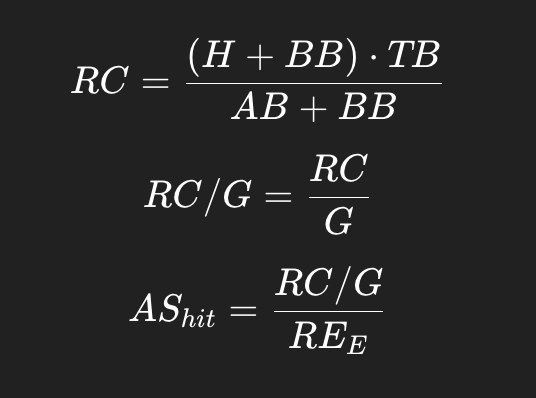
Interpretation:
The fraction of a team’s scoring atmosphere generated per game.
3) Pitching Module
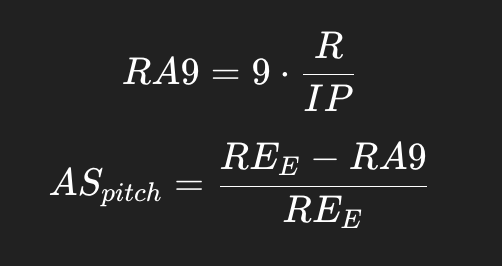
Interpretation:
The fraction of the era’s scoring atmosphere suppressed per full-game equivalent.
4) Unified Atmospheric Total

Pure hitters → pitching = 0
Pure pitchers → hitting = 0
Two-way players → sum both
If a player spans skies, segments are weighted by G (hitters) or IP (pitchers).
II. Final Unified Rankings
Ranked by Atmospheric Share Total (AStotal)
Tier I — Simultaneous or Near-Absolute Atmospheric Force
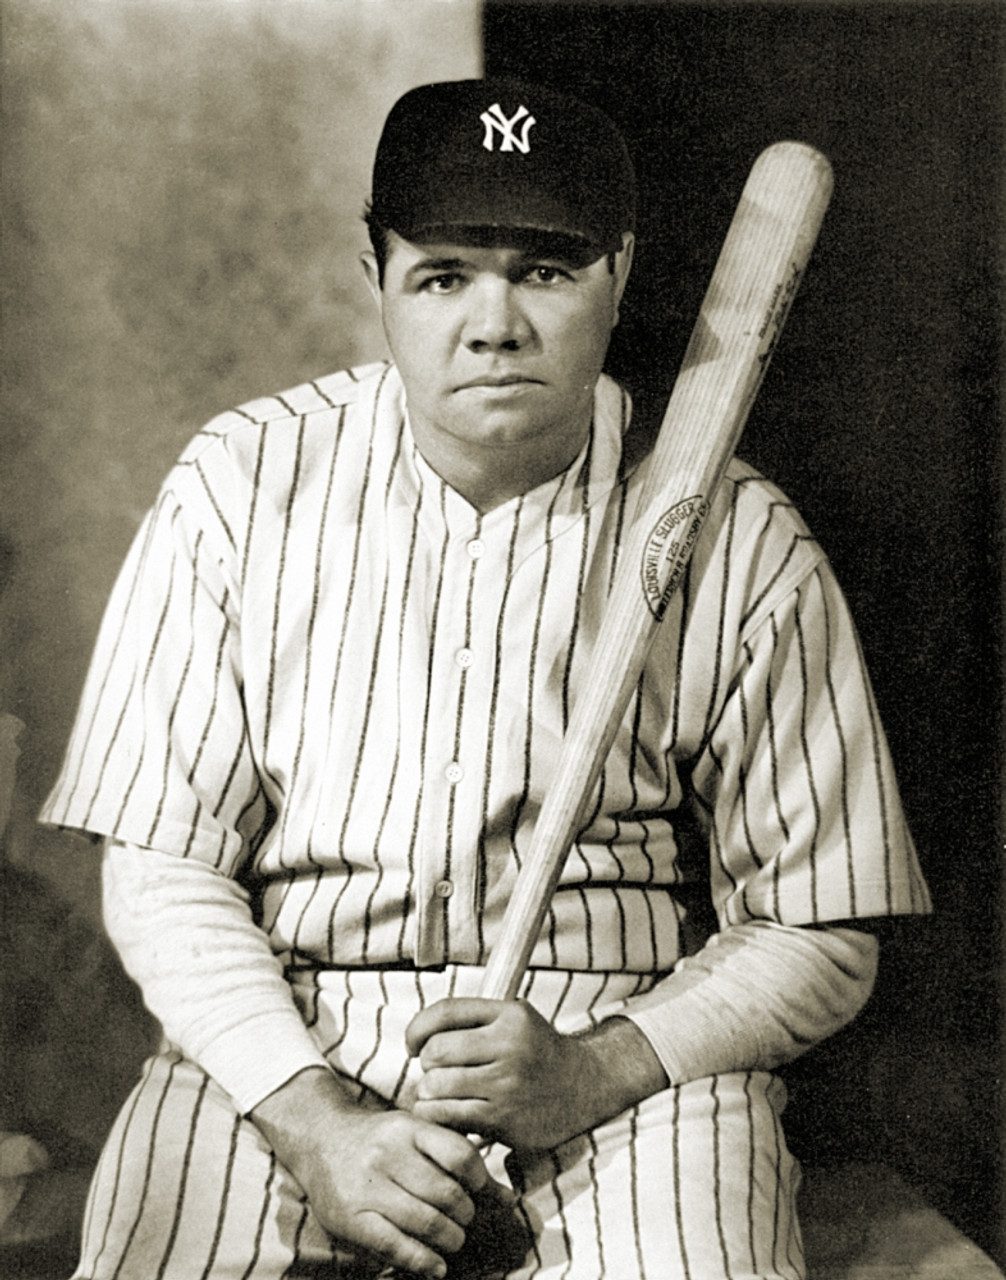
Babe Ruth (TW) — 0.422
Ruthian hitting (21.5%)
Deadball pitching (20.7%)
Sequential dual-force
Bullet Rogan (TW) — 0.404
Ruthian pitching (28.4%)
Ruthian hitting (12.0%)
Simultaneous dual-force
Tier II — Dominant Climate Suppressors
Satchel Paige (P) — 0.354
Walter Johnson (P) — 0.309
Lefty Grove (P) — 0.283
These pitchers penetrated deeply into their respective skies, especially Johnson under Deadball compression.
Tier III — Apex Hitting Penetrators
Josh Gibson (H) — 0.224 (Ruthian sky)
Ted Williams (H) — 0.220 (WWII/Integrated sky, 4.65 RE)
Shoeless Joe Jackson (H) — 0.210 (Deadball)
Lou Gehrig (H) — 0.205 (Ruthian)
Ty Cobb (H) — 0.201 ( career blended Deadball/Ruthian)
Note:
Cobb’s Deadball segment alone penetrates 0.222 , placing him in the apex band alongside Gibson and Williams.
Tier IV — High Structural Contributors
Pete Hill (H) — 0.187 (Deadball)
Oscar Charleston (H) — ~0.183 ( career blended Deadball/Ruthian)
Charleston’s blended number reflects rough cross-sky exposure; a precise split would slightly refine placement.
III. What the Ranking Actually Shows
1. Ruth vs Rogan Is an Architectural Distinction
Ruth’s force is phase-separated (Deadball pitching + Ruthian hitting).
Rogan’s force is phase-integrated (simultaneous inside one sky).
Numerically Ruth slightly exceeds Rogan.
Structurally Rogan compounds force within a single climate.
This is not myth — it is atmospheric physics.
2. The Deadball Compression Effect
Under 3.72 RE:
Cobb (22.2%)
Jackson (21.0%)
Penetrate a much tighter sky.
Deadball dominance is harder to achieve per run produced because scoring volume is lower.
3. Williams’ Proper Placement
Under 5.08 RE, Williams looked like a ~20% penetrator.
Under his proper post-1935 sky (4.65 RE):
- AS_hit ≈ 0.220
He joins Cobb Deadball and Gibson in the 0.22 penetration tier.
Climate declaration matters.
4. Why This System Is Stable
This framework:
Does not rely on OPS+ or ERA+
Does not depend on league-average dispersion
Does not require boundary inflation
Does not collapse segregated leagues into separate universes
It requires only:
Production or suppression divided by declared atmospheric physics.
Dominance becomes physically interpretable.
IV. The Structural Insight
When dominance is measured as atmospheric penetration :
~0.18–0.20 = elite
~0.22 = apex penetrator
~0.30+ = climate-dominant pitcher
~0.40+ = two-way atmospheric engine
Only two players cross 0.40:
Ruth
Rogan
That separation remains stable across reasonable refinements.
V. The Architectural Conclusion
Baseball history does not need mythic reconciliation.
It needs constitutional clarity:
Declare the sky.
Divide performance by climate.
Sum simultaneous force.
Once that is done:
Ruth is the greatest sequential dual-force.
Rogan is the greatest simultaneous dual-force.
Gibson, Cobb (Deadball), and Williams are the deepest pure hitting penetrators.
Paige and Johnson are the most climate-suppressive arms.
The field stabilizes.
Dominance becomes measurable.
Deep baseball history becomes one coherent atmospheric system.
Perfect. Here is the final, fully integrated addendum , incorporating:
The algebraic asymmetry
Why it exists
Why it does not bias pitching upward
Why pitching can appear numerically larger
Why that reflects structural leverage rather than formula distortion
Clean, precise, and publication-ready.
Addendum: On Asymmetry, Pitching Scale, and Atmospheric Leverage
A technical question may arise:
The hitting and pitching modules are not algebraically identical.
Does this asymmetry bias the system?
Does it cause pitching to be “rated higher”?
The answer is no.
But the explanation requires precision.
I. The Structural Difference
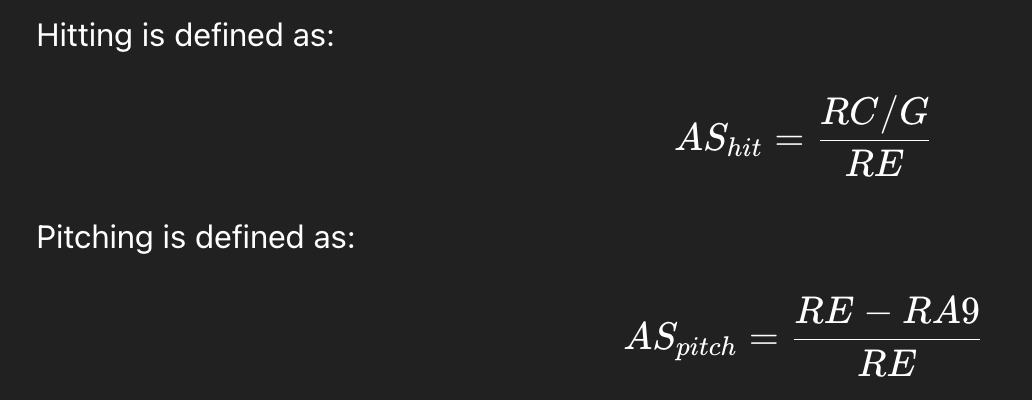
At first glance, this appears asymmetric.
Hitting is measured as a direct share of production.
Pitching is measured as a differential from baseline.
But this is not a flaw.
It reflects the structural reality of the two roles.
II. Why Hitting Is Absolute
Hitting generates runs.
It adds to the scoring environment.
A hitter’s share is therefore measured directly:
Production divided by the declared sky.
There is no meaningful “baseline” other than zero production.
Hitting is additive.
III. Why Pitching Is Differential
Pitching does not generate runs.
It suppresses them.
A pitcher must be evaluated relative to what the sky would otherwise produce.
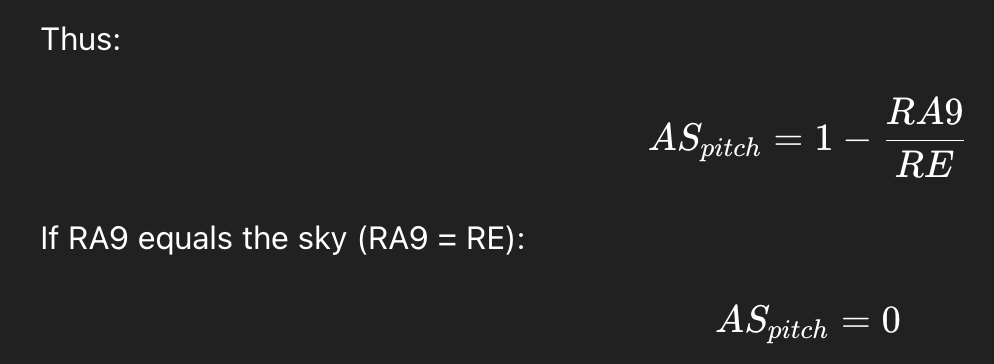
The pitcher has not altered the atmosphere.
Positive values indicate climate suppression.
Pitching is inherently baseline-relative because suppression is inherently baseline-relative.
IV. The Deep Symmetry
If rewritten in fully symmetric ratio form:
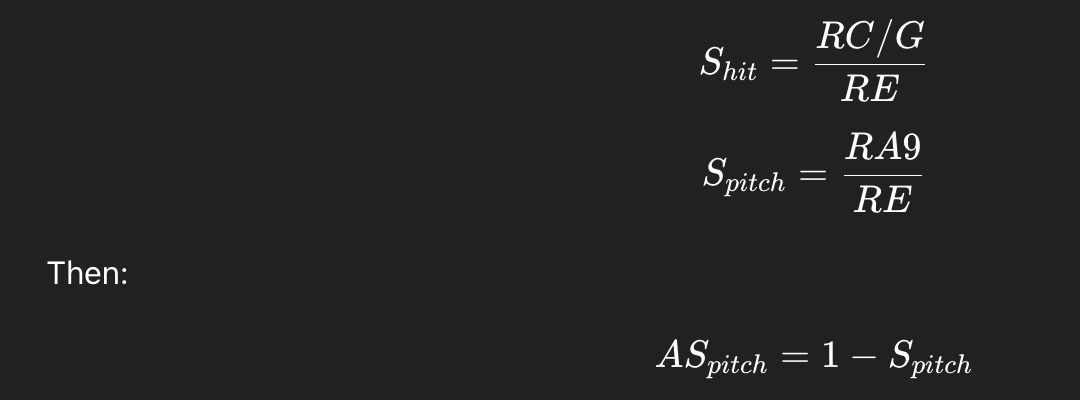
The modules share the same denominator.
They operate in the same units.
The asymmetry is algebraic translation, not structural imbalance.
Both are measured against the same sky.
V. Why Pitching Can Appear Numerically Larger
Even with perfect symmetry, pitchers often produce larger numerical values than hitters.
This is not caused by the formula.
It is caused by leverage.
A hitter controls a fraction of team scoring per game.
A pitcher controls the entirety of opponent scoring per full-game equivalent.
The scope of influence differs.
Elite hitters typically penetrate ~0.20–0.22 of the sky.
Elite pitchers can suppress ~0.30–0.40 of the sky.
This reflects structural control of the run environment — not mathematical favoritism.
VI. Why This Is a Feature, Not a Bug
True symmetry could be written as:

But that would produce negative values for pitchers and obscure interpretability.
The current formulation ensures:
Zero = climate neutrality
Positive = atmospheric control
Larger = greater total climate manipulation
It preserves intuitive reading while maintaining unit consistency.
VII. Final Clarification
The framework does not inflate pitching.
It reveals pitching’s structural leverage.
Hitting and pitching are not mirror processes.
One adds runs.
One removes them.
The formulas reflect that ontological difference while preserving a unified climate denominator.
The asymmetry clarifies reality.
It does not distort it.