Top 36 Hitters/Pitchers/Two Way Players of the Pre-1980 Era — Ranked by EVG (Extreme Value Generation)
Top 36 Hitters/Pitchers/Two Way Players of the Pre-1980 Era -- Ranked by EVG (Extreme Value Generation)
Top 36 Hitters / Pitchers / Two-Way Players of the Pre-1980 Era
Ranked by EVG (Extreme Value Generation)
Why EVG Exists
OPS+ and ERA+ are indexed to 100, but they do not share identical distribution geometry.
OPS+ has a long right tail (200+ is possible).
ERA+ is structurally compressed (160 approaches the ceiling).
Direct comparison flattens pitchers.
Two-way players get split into narrative fragments.
EVG exists to measure boundary pressure , not narrative accumulation.
It asks:
How much normalized extreme value did a player generate relative to the structural ceiling of their role?
Model Assumptions (locked)
Tail exponent: γ = 2
League baseline: 100
Elite ceilings:
200 OPS+ (hitters)
160 ERA+ (pitchers)
Volume Gates
All hitters: ( g_H = 1 ) (≥ 3000 PA)
All pitchers: ( g_P = 1 ) (≥ 1000 IP)
Exception:
- Bullet Rogan — PA = 2500
( g_H = 2500/3000 = 0.8333 )
( g_P = 1 )
- Babe Ruth includes ERA+ 122 , with both lanes at full gates.
EVG Formula
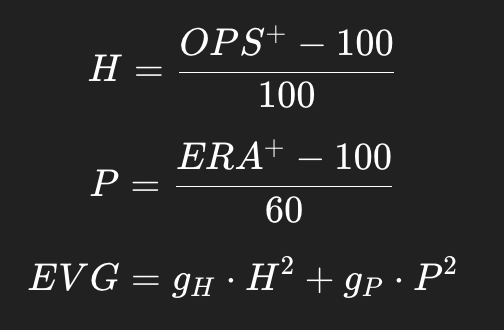
Interpretation:
0 = league average
1 ≈ structural elite ceiling in one lane
1 requires rupture-level production or dual-lane compounding
Final EVG Rankings (Top 36)
Babe Ruth (TW) — OPS+ 206, ERA+ 122 — 1.2580
Josh Gibson (H) — OPS+ 202 — 1.0404
Satchel Paige (P) — ERA+ 159 — 0.9669
Ted Williams (H) — OPS+ 191 — 0.8281
Bullet Rogan (TW) — OPS+ 154, ERA+ 141 — 0.7099
Lefty Grove (P) — ERA+ 148 — 0.6400
Lou Gehrig (H) — OPS+ 179 — 0.6241
Walter Johnson (P) — ERA+ 147 — 0.6136
Ed Walsh (P) — ERA+ 146 — 0.5878
Joe Wood (P) — ERA+ 146 — 0.5878
Buck Leonard (H) — OPS+ 175 — 0.5625
Rogers Hornsby (H) — OPS+ 175 — 0.5625
José Méndez (P) — ERA+ 145 — 0.5625
Turkey Stearnes (H) — OPS+ 173 — 0.5329
Cristóbal Torriente (H) — OPS+ 172 — 0.5184
Oscar Charleston (H) — OPS+ 172 — 0.5184
Mickey Mantle (H) — OPS+ 172 — 0.5184
Joe Williams (P) — ERA+ 143 — 0.5136
Addie Joss (P) — ERA+ 143 — 0.5136
Pete Hill (H) — OPS+ 171 — 0.5041
Dan Brouthers (H) — OPS+ 171 — 0.5041
Carlos Royer (P) — ERA+ 142 — 0.4900
Ray Brown (P) — ERA+ 142 — 0.4900
Shoeless Joe Jackson (H) — OPS+ 170 — 0.4900
Martín Dihigo (TW) — OPS+ 139, ERA+ 134 — 0.4732
Ty Cobb (H) — OPS+ 168 — 0.4624
Kid Nichols (P) — ERA+ 139 — 0.4225
Mule Suttles (H) — OPS+ 164 — 0.4096
Mordecai Brown (P) — ERA+ 138 — 0.4011
Cy Young (P) — ERA+ 138 — 0.4011
Jimmie Foxx (H) — OPS+ 163 — 0.3969
Pete Browning (H) — OPS+ 163 — 0.3969
Dave Orr (H) — OPS+ 162 — 0.3844
Christy Mathewson (P) — ERA+ 136 — 0.3600
Hank Greenberg (H) — OPS+ 159 — 0.3481
Grover Cleveland Alexander (P) — ERA+ 135 — 0.3403
Key Structural Result
Rogan ranks #5 overall under EVG because this framework allows two-way boundary pressure to accumulate mathematically rather than narratively.
Dihigo enters at #25 due to compounded dual-lane pressure, even without rupture-tier performance in either lane alone.
Ruth remains consensus #1 , as his offensive rupture combines with meaningful pitching contribution.
What EVG measures is not accumulation, but proximity to structural limits. It formalizes how far a player moved toward the outer boundary of what their role historically allowed. This ranking is therefore less about nostalgia and more about geometry — about the curvature of possibility inside competitive space. Two-way players rise here not because of romance, but because independent lanes of extremity compound under normalization. Ruth remains first not by myth but by measurable rupture. Rogan’s elevation is not sentiment but structural consequence. EVG does not replace other frameworks; it isolates a single dimension of greatness: how close a player pushed the edge of the game.